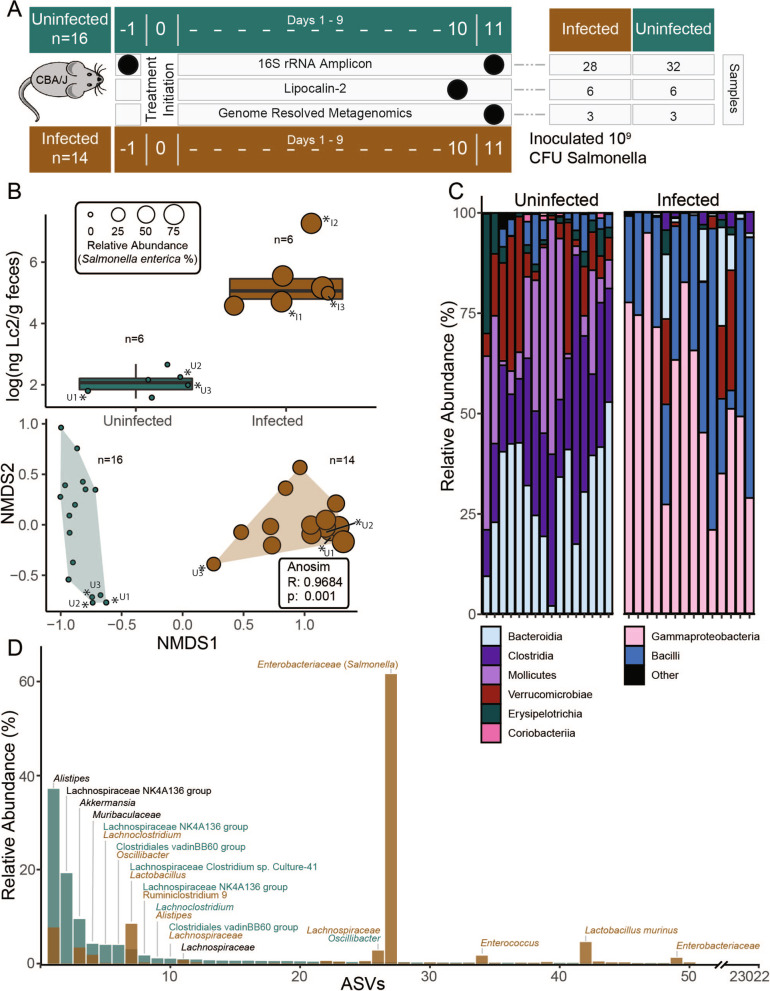
Fig. 1.
Amplicon sequencing of the CBA/J gut reveals shifts in microbiome composition with inflammation. A Experimental design shows the number of mice in healthy (green) and infected (brown, infected with 109 CFU Salmonella) treatments with fecal sampling times and corresponding analysis indicated by black circles. B Boxplots show lipocalin-2 (Lc2) levels of mice in each treatment during peak infection (top), with Salmonella relative abundance indicated by circle size. Non-metric multidimensional scaling of Amplicon Sequence Variant (ASV) Bray–Curtis distances showing significantly distinct communities between treatments at time of sampling with points scaled to Salmonella relative abundance (bottom). Asterisks indicate mice used to create the CBAJ-DB. C ASV Class distribution is depicted by stacked bar charts of healthy and infected communities, with each bar representing a single mouse at the day 11 timepoint. D Rank abundance curve of mean ASV relative abundance by treatment in mice sampled to create the CBAJ-DB. Bars represent a single ASV and are colored by treatment, with ASVs ranked separately for each treatment to show the changes in rank and abundance with inflammation. Bars are labeled with taxonomic identity in text if greater than 3% mean relative abundance in either treatment, with text color denoting treatment. Black text indicates both treatments have the same ASV taxonomy within that rank

