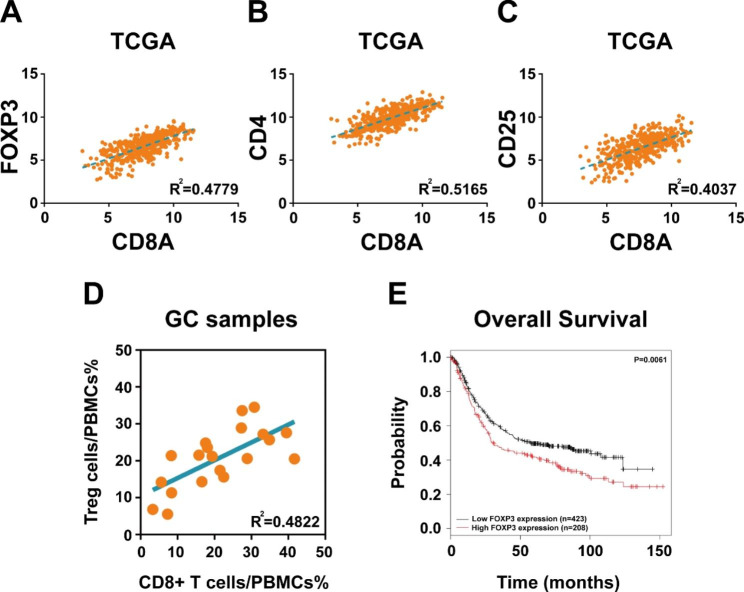
Fig. 1.
Treg cells show positive correlation with CD8 + T cells in gastric cancer. (A) Pearson’s correlation coefficient revealed a positive correlation between FOXP3 and CD8A expression in TCGA database. (B) Pearson’s correlation coefficient revealed a positive correlation between CD4 and CD8A expression in TCGA database. (C) Pearson’s correlation coefficient revealed a positive correlation between CD25 and CD8A expression in TCGA database. (D) Flow cytometry assay showed positive correlation between Treg cells and CD8 + T cells in 20 fresh gastric cancer samples. (E) KMplotter database demonstrated that patients with high FOXP3 expression had worse overall survival than those with low FOXP3 expression

