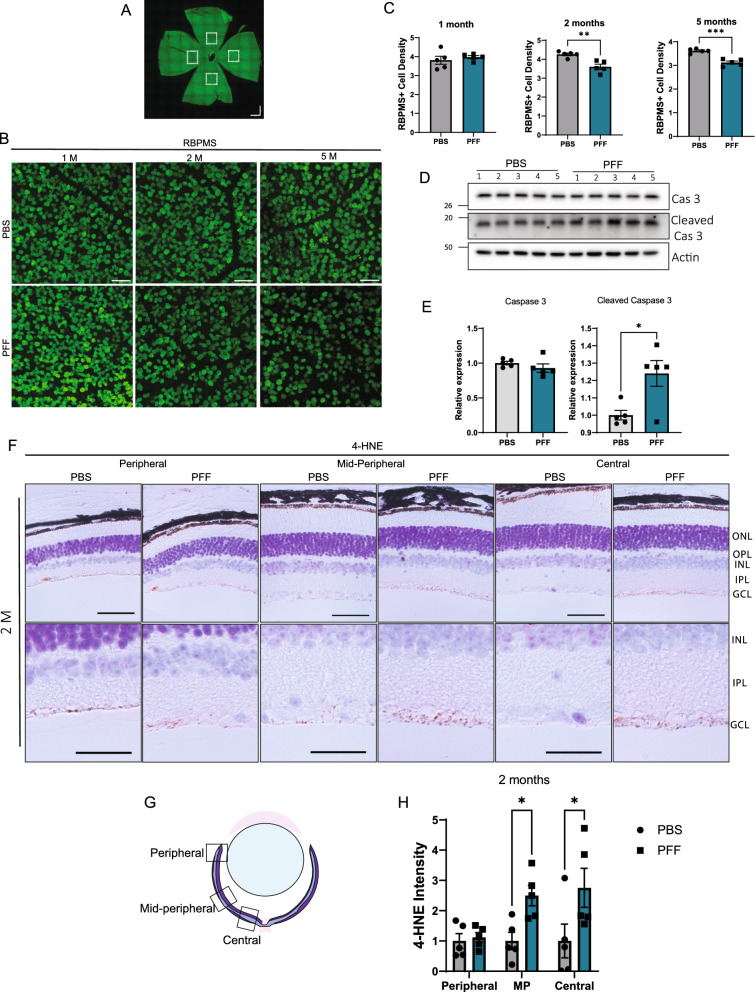
Fig. 4.
Intravitreal injection of PFFs leads to oxidative stress and RGC loss. A Representative image of the whole mount retina. Images were taken from 500–600 µm from the optic nerve. B Representative images of RBPMS immunostaining in the retinal whole mounts. Scale bar: 50 µm. C Quantification of RBPMS-positive cell numbers at 1, 2, and 5 months post injection. Cell density is expressed as cells per 1000 µm.2. D Representative western blot images of the retinal lysates for the total and cleaved caspase 3 at 2 months post injection. E Quantification of the total and cleaved caspase 3 in the retina of injected mice. F Representative images of 4-HNE immunoreactivity in the retinal sections at 2 months after injection. Positive staining is observed mainly in the GCL. Scale bar: 50 µm. G Diagram of the peripheral, mid-peripheral and central retina regions. H Quantification of 4-HNE intensity in the GCL layer in the peripheral, midperipheral and central retina. Data are expressed as means ± s.e.m, relative to control (PBS, n = 5 mice, PFF n = 5 mice; *p < 0.05, **p < 0.01, ***p < 0.001; Student’s t-test and Two-way ANOVA)

