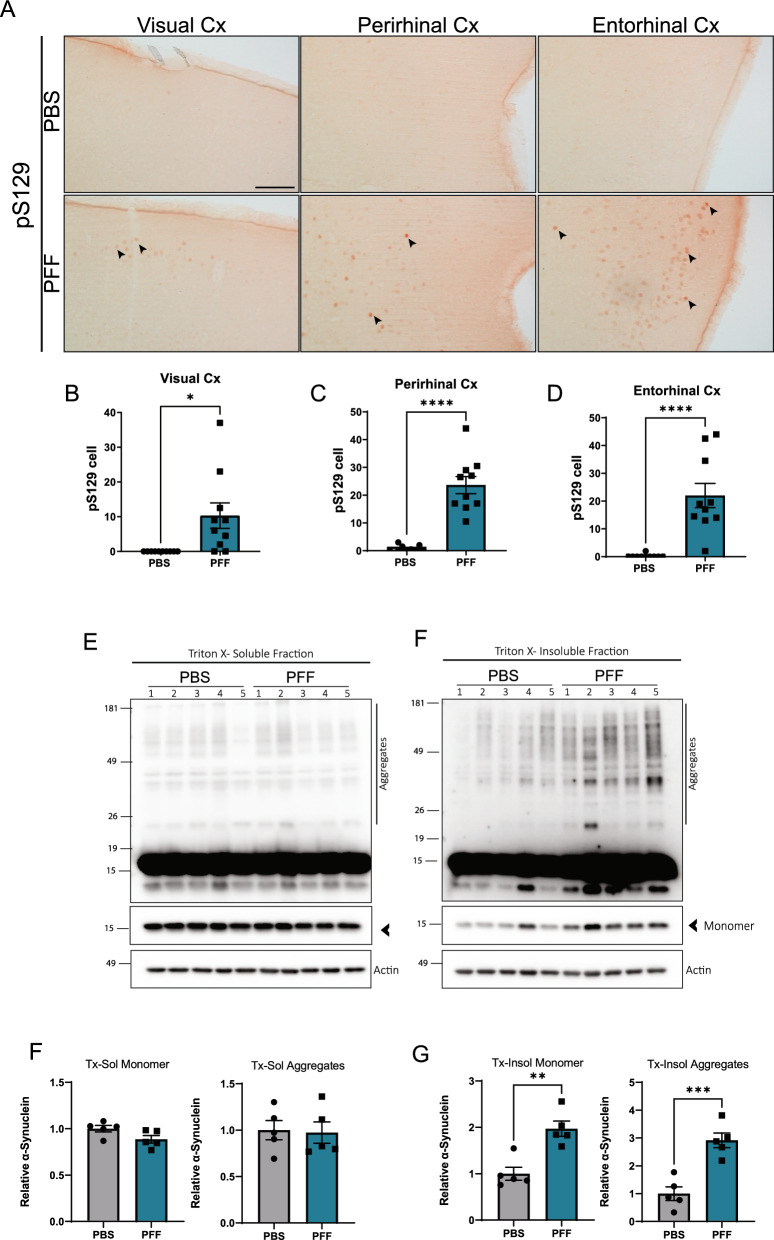
Fig. 7.
Intravitreally injected α-synuclein causes brain α-synuclein accumulation 5 months after injection. A Representative images of pS129 immunostaining in the visual, perirhinal, and entorhinal cortices at 5 months after injection. B–D Quantification of pS129-positive cell puncta in the cortical areas. Numbers represent the total number of puncta in the indicated region from one coronal brain slice. Visual Cortex (B), Perirhinal Cortex (C) and Entorhinal Cortex (D). Brain areas were delimited using the Allen Atlas as reference. Scale bar: 100 µm. Data are expressed as means ± s.e.m. (PBS, n = 10; PFF, n = 10; *p < 0.05, **p < 0.01, ***p < 0.001; Student’s t-test). E–F Representative western blots of α-synuclein in the rhinal cortex at 5 months post injection. F, G Quantification of α-synuclein monomer and aggregates (above 20 kDa) in the triton-x soluble E and insoluble F fractions. Data are expressed as means ± s.e.m, relative to control (PBS, n = 5; PFF, n = 5; *p < 0.05, **p < 0.01, ***p < 0.001; Student’s t-test)

