Fig. 8.
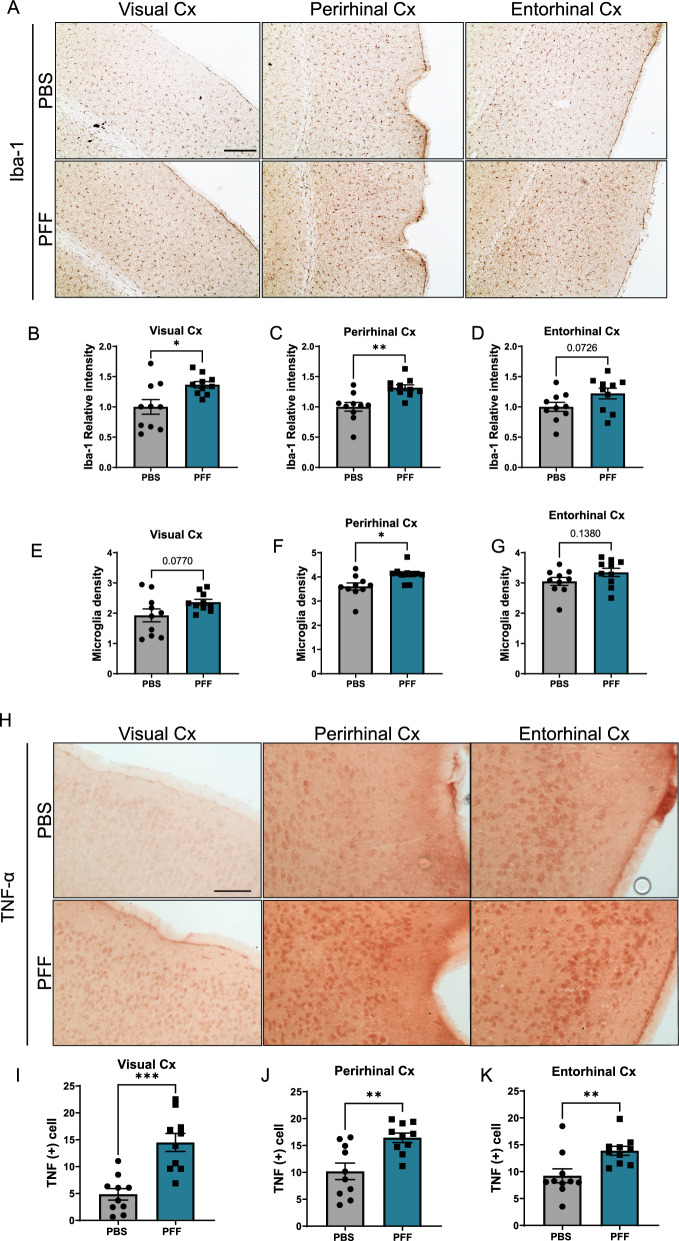
Intravitreally injected α-synuclein causes the cortical inflammation 5 months after injection. A Representative images of microglia (Iba-1–positive cells) in the visual cortex, perirhinal cortex, and entorhinal cortex. B–D Quantification of the optical density of Iba-1 immunostaining in the cortical areas. E–G Microglial density in the visual, perirhinal and entorhinal cortices, normalized per area and expressed as microglia cell number per 10,000 µm2. (H) Representative images of TNF-α immunostaining in the cortical areas. (I-K) Quantification of TNF-α–positive cell counts in the cortical areas per 10,000 µm2. Scale bar: 100 µm. Data are expressed as means ± s.e.m. (PBS, n = 10; PFF, n = 10; *p < 0.05, **p < 0.01, ***p < 0.001; Student’s t-test)

