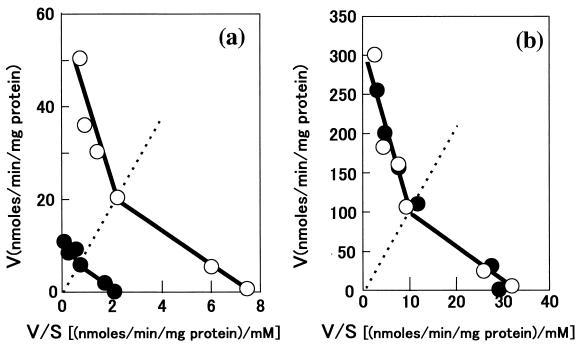
FIG. 2.
Eadie-Hofstee plots of glucose transport in wild-type strain YHK142 (○) and CSF1 disruptant strain YHK1144 (●) at 10°C (a) and 30°C (b). The glucose concentration ranged from 0.1 to 100 mM (specific radioactivity, 6 to 740 kBq/μmol). The assay mixture was incubated for 5 s, the period during which uptake was in the linear range. Dashed lines represent a substrate concentration of 10 mM. Data were obtained from duplicate experiments.

