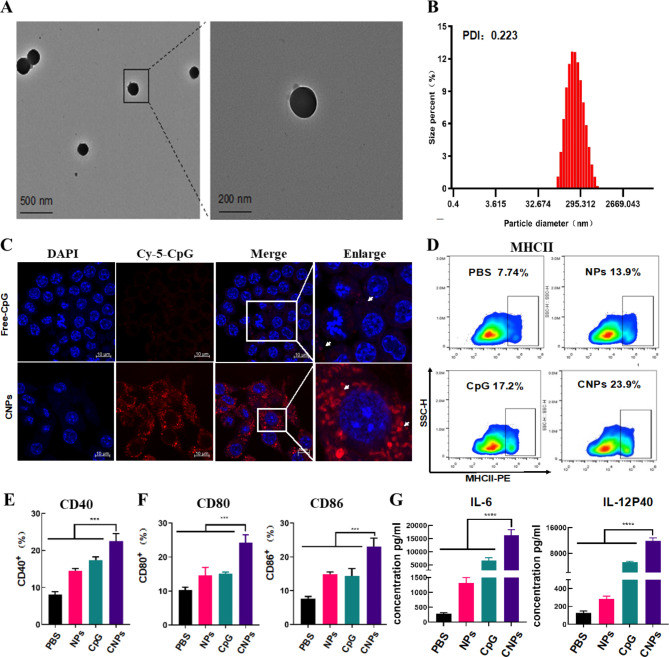
Fig. 1.
Characterization of CNPs, Intracellular uptake of CpG ODN by DCs and activation of DCs. (A) TEM (transmission electron microscopy) imaging of CNPs. (B) DLS (dynamic light scattering) analysis. (C) Fluorescent imaging of intracellular uptake of FITC-labeled CpG ODN by DCs. (D) Expression of MHC-II analyzed by flow cytometry. (E) Expression of CD40 analyzed by flow cytometry. (F) Expression of CD80 and CD86 analyzed by flow cytometry. (G) Secretion of IL-6 and IL12P40. Data are presented as means ± s. d. Statistical significance was calculated by one-way analysis of variance (ANOVA). (n = 3), **, P < 0.01 ***, P < 0.001

