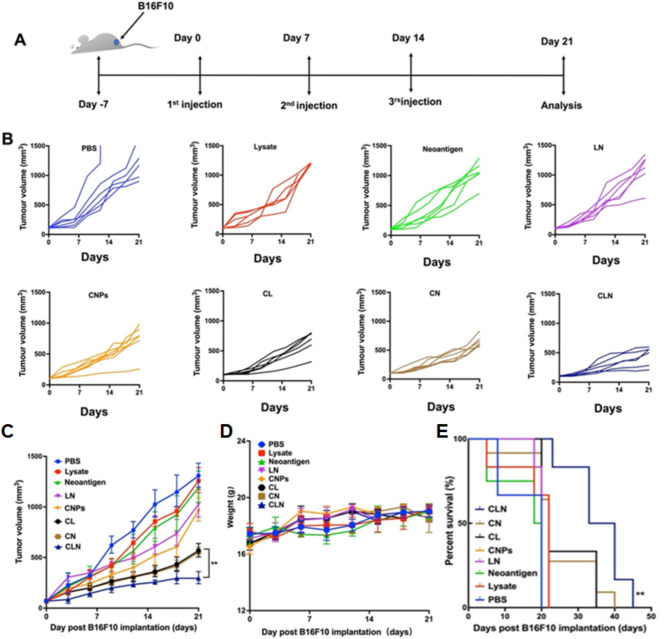
Fig. 3.
Analysis of tumor growth, body weights and survival rates. (A) Treatment schedule. (B) Individual tumor growth curves of each animal treated with different substrates, including PBS, lysate, neoantigens, LN, CL, CN and CLN. (C) Tumor volumes were measured at indicated time-points and shown as average of duplicate measurements with standard error bars (n = 6 for each group). (D) The body weights of mice were measured at indicated time-points and shown as average of duplicate measurements with standard error bars (n = 6 for each group). (E) Survival curves of mice after various treatments

