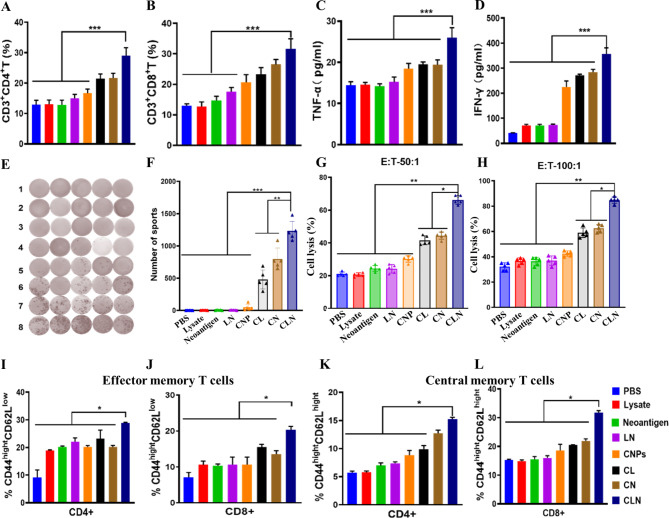
Fig. 4.
Flow cytometry and elispot analysis and CTL assays. (A) The percentage of CD3+CD4+ T cells infiltrated in tumor tissues. (B) The percentage of CD3+CD8+ T cells infiltrated in tumor tissues. (C) The secretion of TNF-α in serum samples. (D) The secretion of INF-γ in serum samples. (E) The imaging results of elispot analysis on INF-γ expression in isolated spleens. (F) INF-γ expression in isolated spleens. (G) CTL data with E:T 50:1. (H) CTL data with E:T 100:1. (I) CD4+CD44highCD62Llow effector memory T cells. (J) CD8+CD44highCD62Llow effector memory T cells. (K) CD4+CD44highCD62Lhigh central memory T cells. J CD8+CD44highCD62Lhigh central memory T cells. The data were presented as means ± s. d. Statistical significance was calculated by one-way analysis of variance (ANOVA). (n = 5), *, P < 0.05; **, P < 0.01

