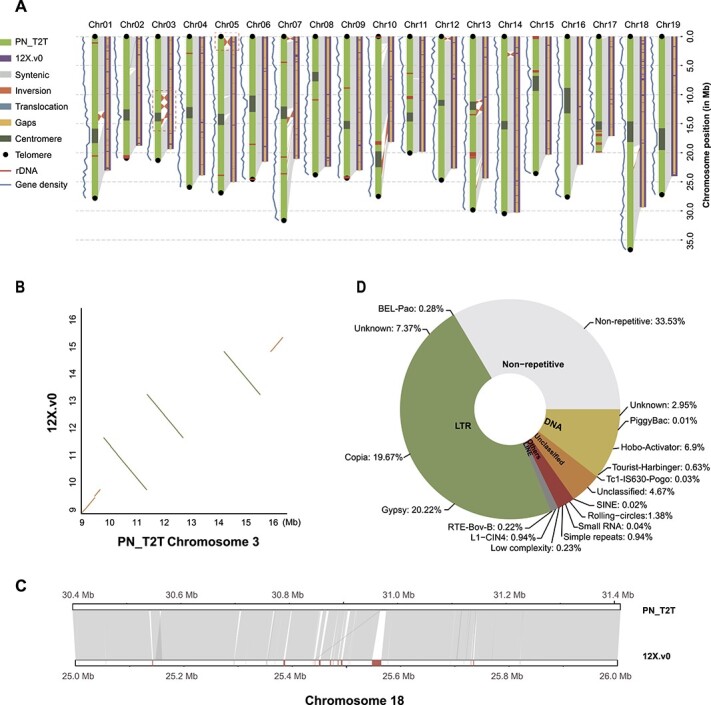
Figure 1.

The T2T gap-free assembly of the grapevine reference genome. (A) Overview of the genome assemblies (12X.v0, right bars; PN_T2T, left bars). The red dashed boxes on chromosomes 3 and 5 indicate differences in large inversions between the two versions of the genomic assembly. (B) Zoomed-in portion of the red dashed box region on chromosome 3 in (A). (C) Plot showing 1-Mb syntenic region between the 12X.v0 and PN_T2T assemblies on chromosome 18. Gray bands connect corresponding collinear regions, and red boxes at the bottom show the gaps in 12X.v0. (D) Types and percentages of different TE families detected in the PN_T2T genome.
