
Figure 3.
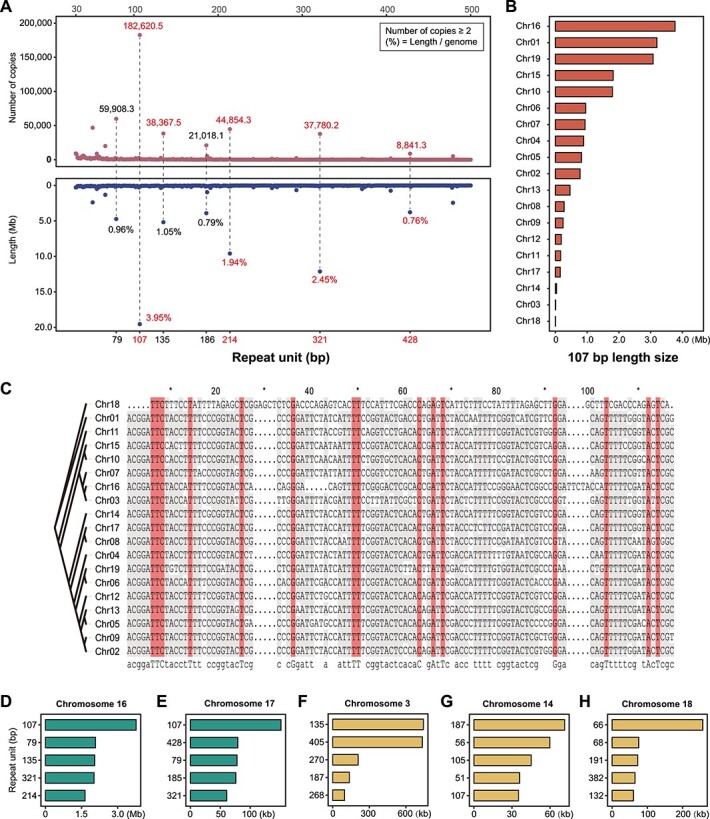
Schematic illustration of centromeric repeat units in the PN_T2T genome. (A) Distribution of different repeat unit lengths in the whole genome. The number of different repeat unit copies is indicated in the upper part of the graphs while the chromosomal percentage of different repeat units is shown in the lower part. (B) Total length of 107-bp repeat unit copies in each chromosome. (C) Alignment of the 107-bp repeat units among 19 chromosomes. (D–H) Total length of different repeat units in chromosomes 16, 17, 3, 14, and 18, respectively.