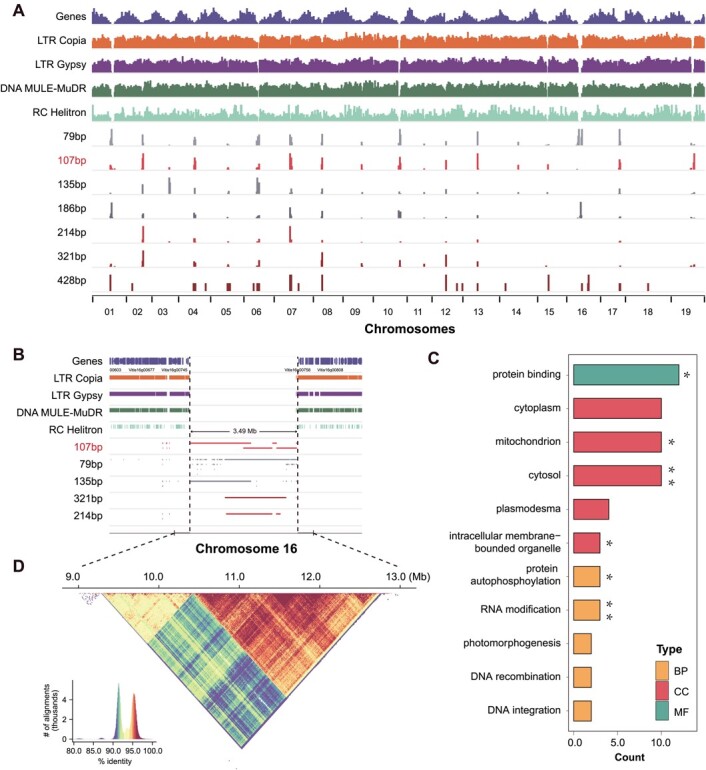
Figure 4.

Characteristics and distribution of repeat unit copies in centromeres. (A) Distribution of genes, TEs, and different repeat units in the whole genome. (B) Visualization of the predicted centromeric region on chromosome 16 in IGV. (C) GO functional annotation of genes captured in centromeres. MF, molecular function; CC, cellular component; BP, biological process. Significant P-values for enrichment: *P < .05. **P < .01. (D) The triangle shows sequence similarity within each haplotype, colored by identity.
