
Figure 5.
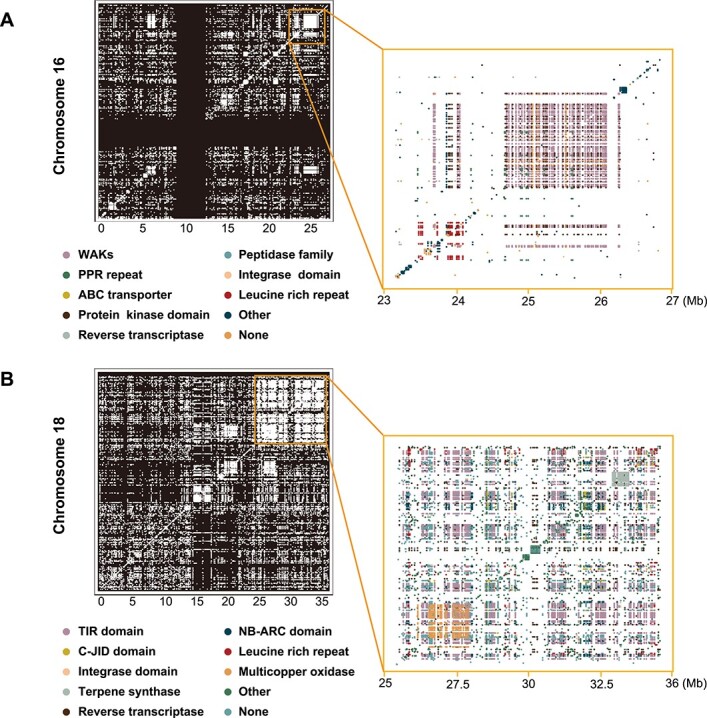
Schematic of identified gene clusters. (A) Gene clusters in chromosomes 16 and 16: 22–27 Mb. (B) Gene clusters in chromosomes 18 and 18: 25–36 Mb. The graphs on the right represent the regions in orange boxes on the left. Different colors indicate different gene clusters. None, genes for which no domain has been identified by Pfam database; Other, other gene clusters with small numbers of genes.