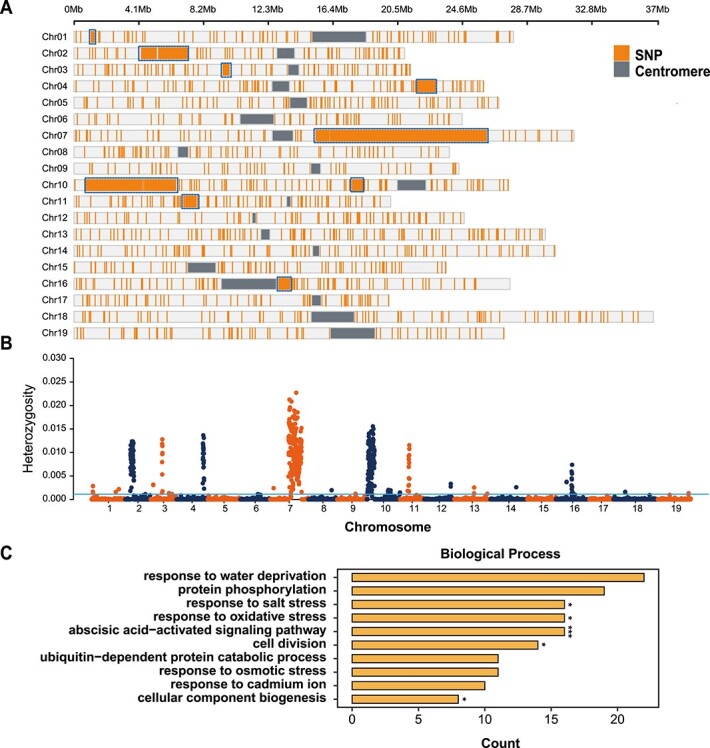
Figure 6.

Characterization of heterozygous regions in PN40024. (A) Heterozygous sites shared in all four PN40024 samples. The gray bars indicate the centromere region while the orange lines indicate the heterozygous sites that exist in all samples. Blue boxes highlight the large heterozygous fragments. (B) Heterozygosity in the PN40024 genome calculated with no overlapping 100-kb windows across four samples. (C) GO enrichment analysis of genes contained in heterozygous sites shown in (A). Significant P-values for enrichment: *P < .05, ***P < .001.
