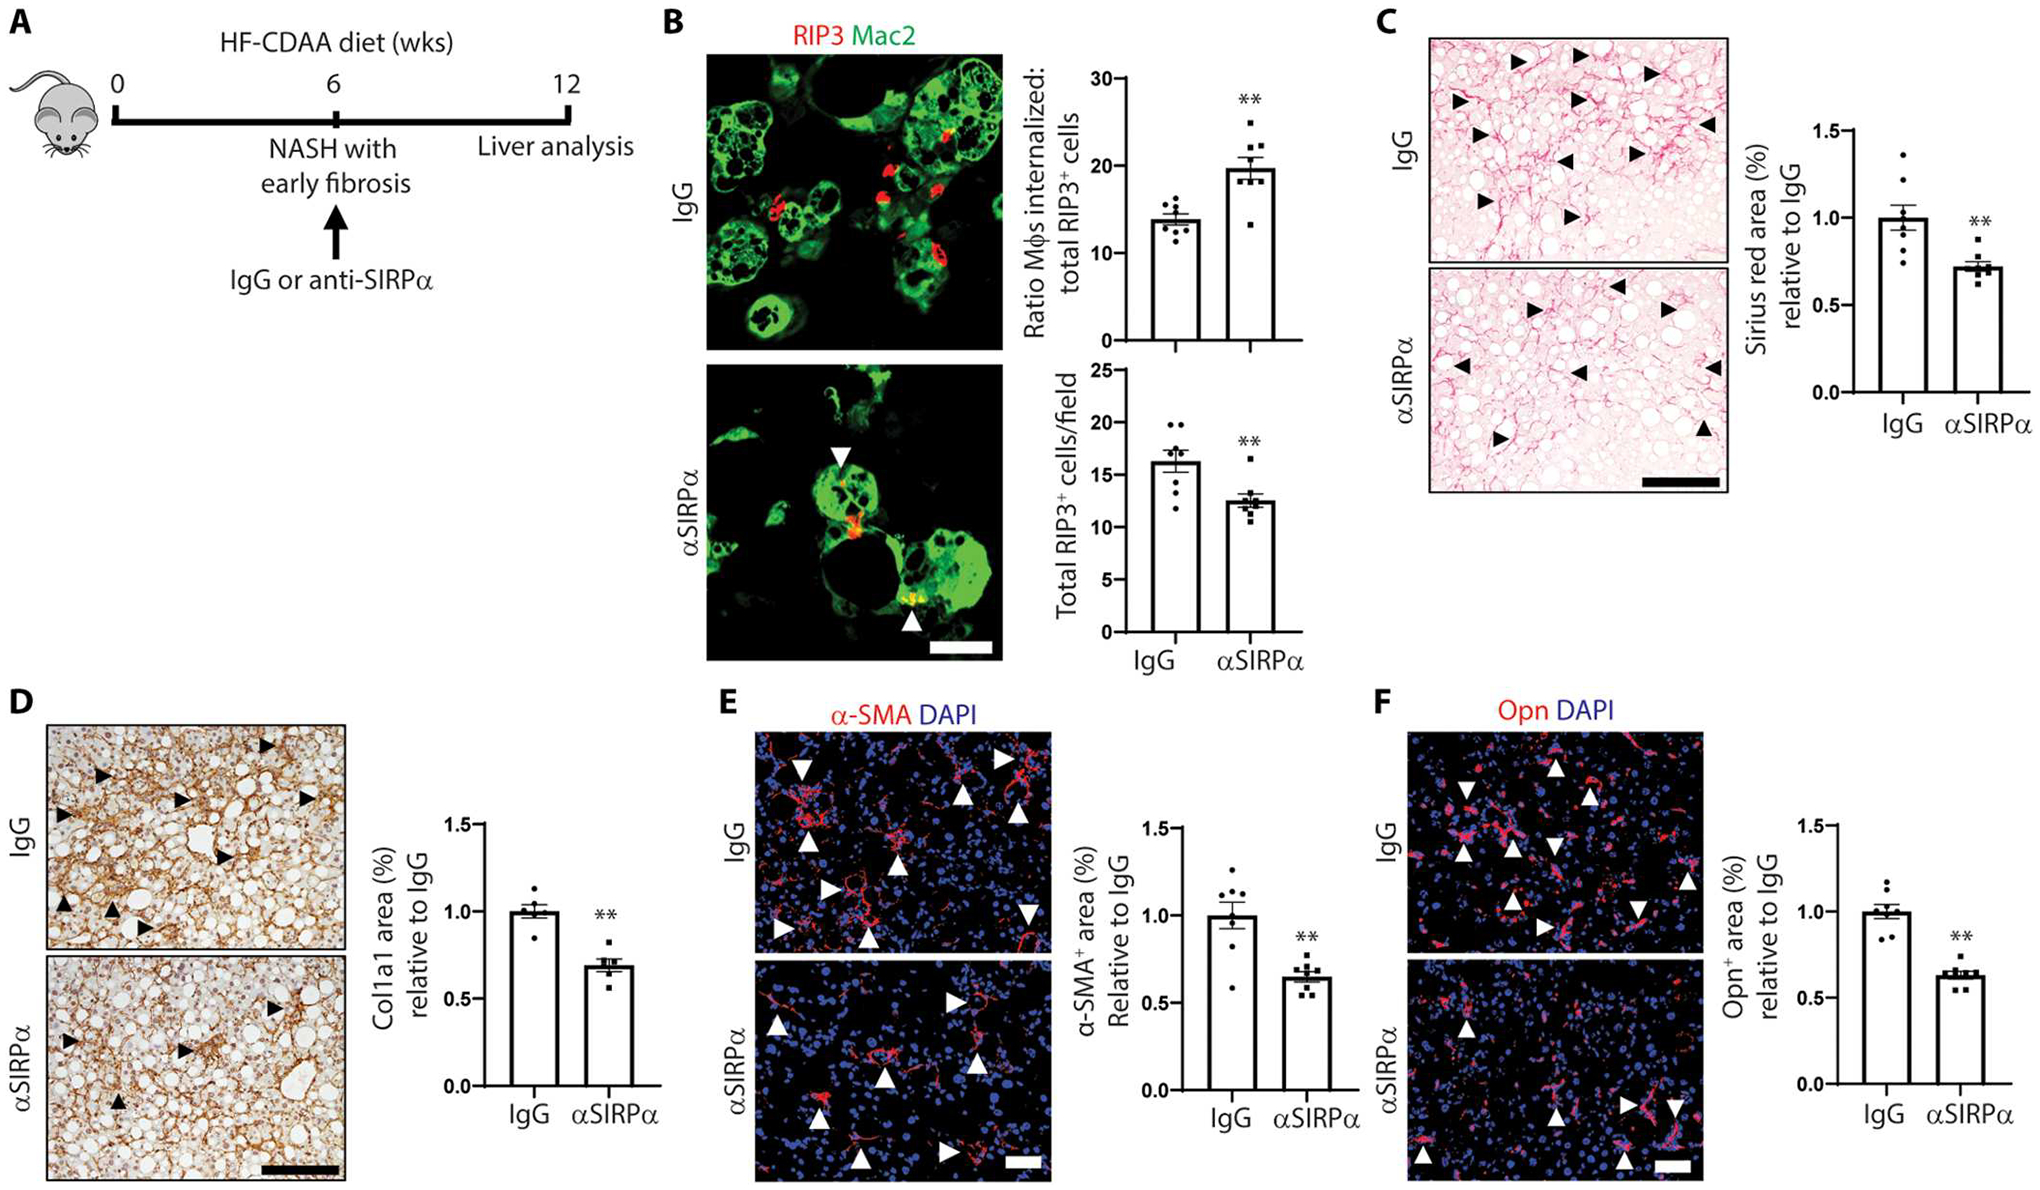
Fig. 7. Anti-SIRPα increases necHC engulfment and ameliorates hepatic fibrosis in mice with established early NASH.

Male C57BL/6J mice were fed the HF-CDAA NASH diet for 12 weeks and treated with anti-SIRPα or IgG between weeks 6 and 12 (n = 6 to 8 mice per group). (A) Illustration of the experimental design. (B) Representative images of liver sections immunostained with anti-Mac2 to stain macrophages (green) and RIP3 (red) in liver sections. Arrowheads depict macrophages with internalized necHCs. Scale bar, 25 μm. The data were quantified as the ratio of macrophage-internalized necHCs to total necHCs and total RIP3+ cells (**P < 0.01). (C) Staining and quantification of picrosirius red–positive area (arrowheads) (**P < 0.01). Scale bar, 100 μm. (D) Liver sections immunostained with anti–collagen 1a1 (Col1a1), with quantification of Col1a1 area, indicated by arrowheads (**P < 0.01). Scale bar, 100 μm. (E) Immunofluorescence staining and quantification of α-SMA–positive area (arrowheads) (**P < 0.05). Scale bar, 50 μm. (F) Immunofluorescence staining and quantification of osteopontin (Opn)–positive area (arrowheads) (**P < 0.05). Scale bar, 50 μm. All data are means ± SEM.
