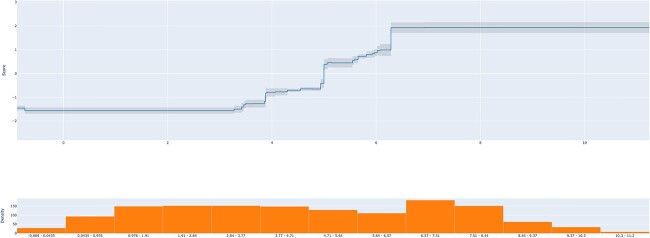
Figure 3.
Behavior of the feature AAT_max, which represents the maximum rate of Antigenicity for AAT, over its possible values ranging from −0.889 to 11.2. The epitope class probability increases when the AAT_max becomes larger than 5 (score above 0). The bottom chart depicts the distribution of the corresponding data points in each feature interval.

