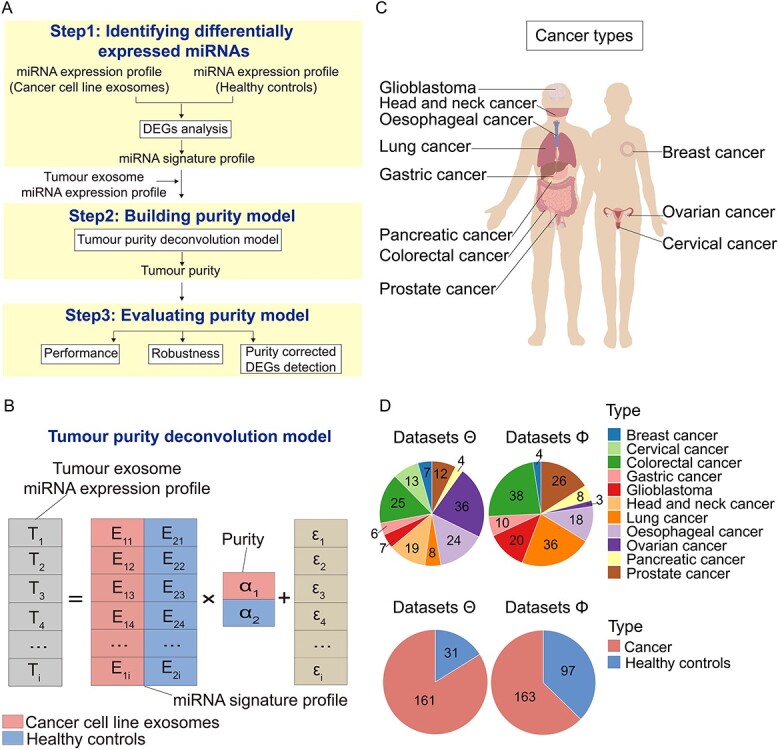
Figure 1.

Overview of a tumour purity deconvolution model ‘ExosomePurity’ and the distribution of cancer types used in the model. (A) As input for a tumour purity deconvolution model ‘ExosomePurity’, an miRNA signature profile is comprised of miRNAs that are differentially expressed between cancer cell line-derived exosomes and healthy cell-derived exosomes and are stably expressed within each group (Step 1). Given the miRNA signature profile and tumour exosome miRNA expression profile, tumour purity is solved by the purity deconvolution model, which uses quadratic programming to estimate parameters (Step 2). The performance and robustness of the model are evaluated using independent and external samples alone or in combination with noise background. Tumour purity is applied to correct the differentially expressed analysis between tumour exosomes and healthy controls (Step 3). (B) Tumour purity deconvolution model. T represents the serum exosome miRNA expression profile of cancer patients. E is the miRNA signature profile of cancer cell line-derived and healthy cell-derived exosomes. α is the proportion matrix of cancer cell- and healthy cell-derived exosomes. (C) Schematic of 11 cancer types. Cancer cohorts include breast cancer, cervical cancer, colorectal cancer, gastric cancer, glioblastoma, head and neck cancer, lung cancer, oesophageal cancer, ovarian cancer, pancreatic cancer and prostate cancer. (D) Pie chart shows the distribution of 11 cancer types and the number of healthy controls and cancer exosome samples in miRNA-Seq datasets Θ (left) and Φ (right) used in the model.
