Figure 2.

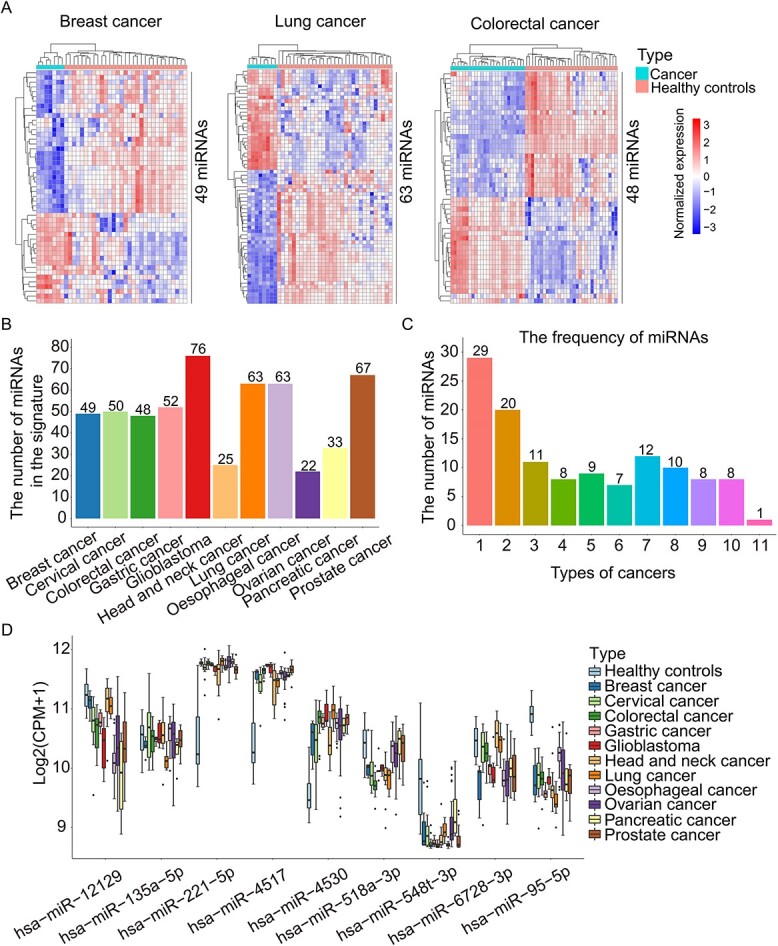
The miRNA signatures of cancer exosomes. (A) Heatmap shows the expression levels of miRNA signatures including 49 differentially expressed miRNAs in breast cancer, 63 in lung cancer and 48 in colorectal cancer. Each column represents an exosome sample from cancer or healthy controls. Each row in the heatmap represents a specific miRNA whose expression is normalized across the column. (B) The number of miRNAs in the signatures of 11 cancer types (breast cancer, cervical cancer, colorectal cancer, gastric cancer, glioblastoma, head and neck cancer, lung cancer, oesophageal cancer, ovarian cancer, pancreatic cancer and prostate cancer). (C) Bar chart shows the frequency of miRNAs in all signatures across 11 cancers. (D) Boxplot shows the expression of miRNAs identified in more than nine types of cancers in miRNA-Seq datasets Θ, including hsa − miR − 12129, hsa − miR − 135a − 5p, hsa − miR − 221 − 5p, hsa − miR − 4517, hsa − miR − 4530, hsa − miR − 518a − 3p, hsa − miR − 548 t − 3p, hsa − miR − 6728 − 3p and hsa − miR − 95 − 5p.
