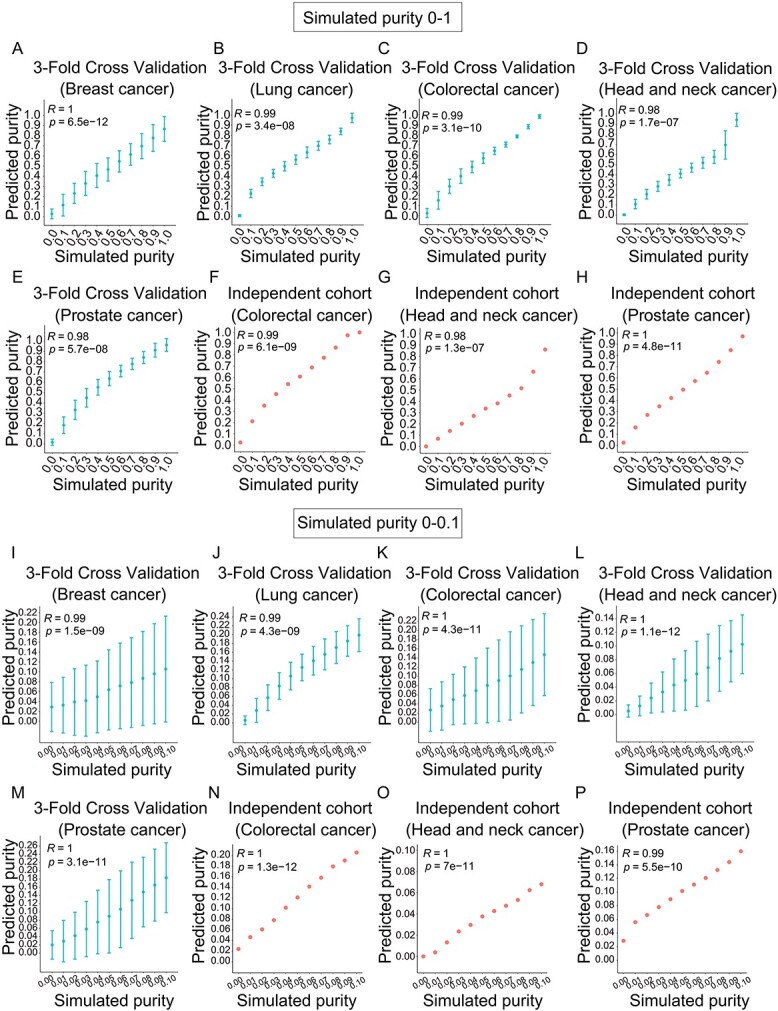
Figure 3.

Performance of exosome purity model evaluated in simulated data. The PC between simulated purity and predicted purity for 3-fold cross-validation (A-E, I-M) and independent cohort Θ0 (F-H, N-P). The tumour purity ranges from 0 to 1 (A-H) and from 0 to 0.1 (I-P) in breast cancer (A, I), lung cancer (B, J), colorectal cancer (C, K), head and neck cancer (D, L) and prostate cancer (E, M).
