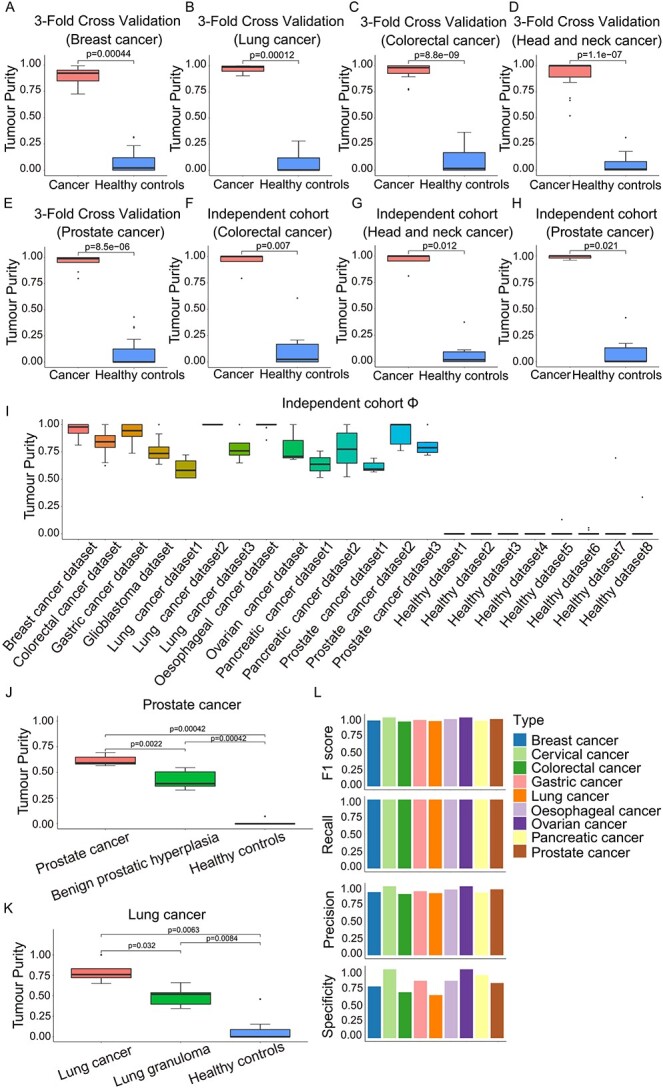
Figure 4.

Performance of exosome purity model evaluated in actual data. Comparison of the predicted tumour purity between cancer cell line-derived exosomes (left bars) and healthy controls (right bars) for 3-fold cross-validation (A-E) in breast cancer (A), lung cancer (B), colorectal cancer (C), head and neck cancer (D) and prostate cancer (E). Comparison of the predicted tumour purity between cancer cell line-derived exosomes (left bars) and healthy controls (right bars) for independent cohort Θ0 (F-H) in colorectal cancer (F), head and neck cancer (G) and prostate cancer (H). The P value is calculated with the Wilcoxon rank-sum test. (I) The predicted tumour purity of external cohort Φ. The boxplots show the purity of tumour patients (left bars), early disease states (middle bars) and healthy controls (right bars) in prostate cancer (J) and lung cancer (K). The model performance is evaluated using Precision, Recall, Specificity and F1 in the combined samples in datasets Θ, patients and healthy individuals in datasets Φ (L). The P value is calculated with the Wilcoxon rank-sum test.
