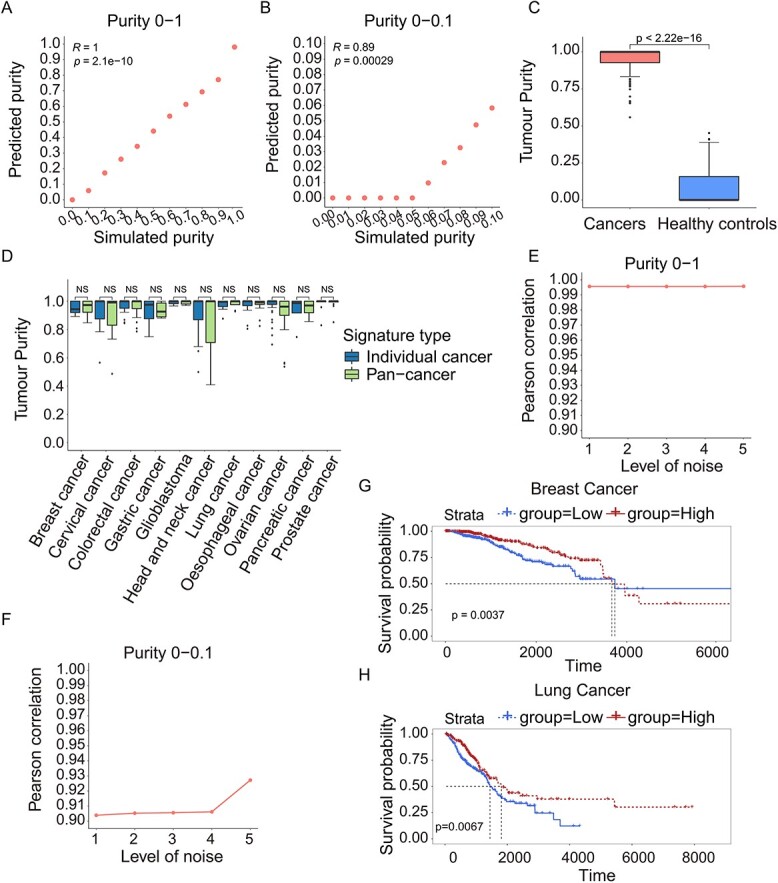
Figure 5.

Performance of pan-cancer exosome purity model evaluated in simulated data and actual data. The PC between simulated and predicted exosome purity for all samples with the tumour purity ranging from 0 to 1 (A) and from 0 to 0.1 (B) in pan-cancer exosome purity model. (C) Comparison of the predicted tumour purity between cancer cell line-derived exosomes (left bars) and healthy controls (right bars) for all samples. (D) Comparison of the predicted tumour purity with 11 individual cancer signatures and pan-cancer signatures for 11 different cancer cell line-derived samples. The P value is calculated with the Wilcoxon rank-sum test. The PC between the simulated and predicted tumour purity ranging from 0 to 1 (E) and from 0 to 0.1 (F) when the different levels of noise added. The Kaplan–Meier curve illustrates the probability of OS according to the average expression levels of the 28 down-regulated miRNAs in breast cancer (G) and lung cancer (H).
