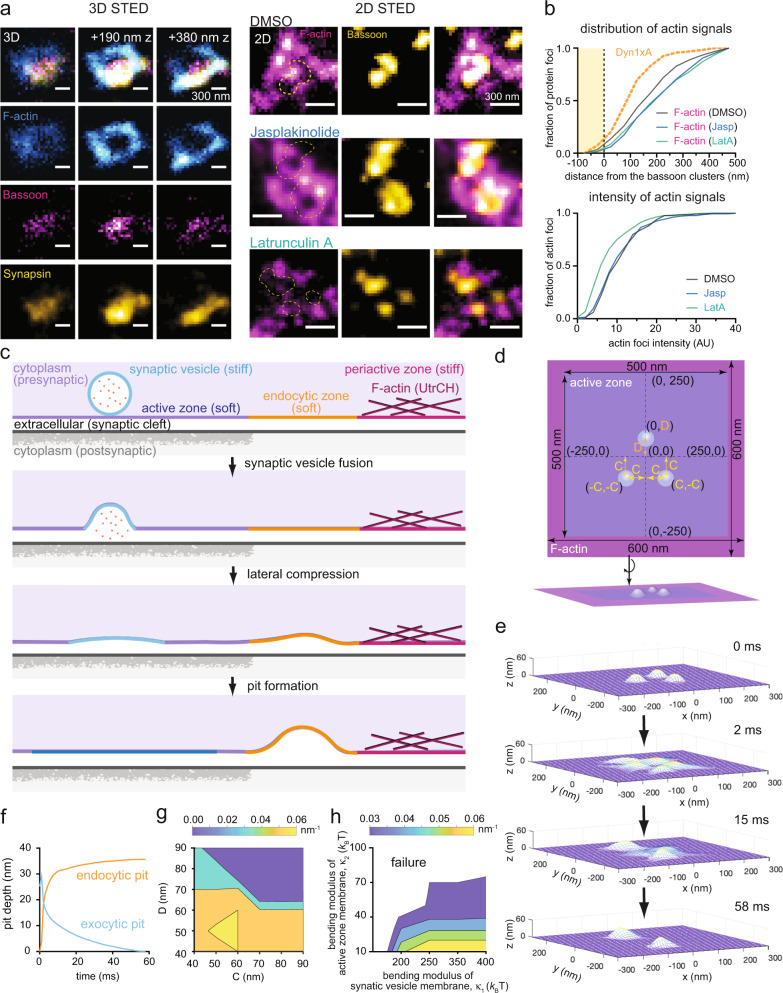
Fig. 1. The lateral membrane compression model for ultrafast endocytosis.
a (left) An example of actin ring distribution in presynapses by 3D STED. The first row shows an overlay of F-actin, Bassoon and Synapsin signals in z-slices separated by 190 nm. Each following row isolates a single fluorescence channel. F-actin is labeled by neuronal expression of EGFP-UtrCH, which is stained by a GFP-antibody and its secondary antibody conjugated to Atto488, Bassoon is labeled by an anti-Bassoon antibody and a secondary antibody conjugated to Atto647N, and Synapsin is labeled by a secondary antibody conjugated to Alexa594. (right) Example 2D STED micrographs showing the localization of filamentous actin (F-actin) relative to the active zone in neurons treated with DMSO (control), Latrunculin A (Lat A), and Jasplakinolide. The active zone is marked by an anti-Bassoon antibody and its secondary antibody conjugated with Alexa594. The dashed circles in the left panels indicate locations of the Bassoon signals. b Cumulative plots showing distribution of F-actin signals against the active zone boundary (top) and intensity of F-actin signals (bottom). The active zone boundary was defined by Bassoon signals. See Supplementary Table 2 for detailed statistical analysis. c A schematic showing the lateral membrane compression model for ultrafast endocytosis. Only a half of the synapse is depicted for clarity. The lateral membrane pressure exerted by exocytosis is predicted to compress the plasma membrane against the stiff periactive zone membrane and induce pit formation at the interface between actin-free and actin-enriched regions, or at the endocytic zone. The membrane bends towards the cytoplasm likely due to multiple factors like lipid asymmetry and the presence of endocytic proteins inside and postsynaptic membrane outside. Note that the active zone is defined as a region juxtaposed to the postsynaptic density (the gray area along the postsynaptic membrane) where neurotransmitter receptors are localized). d Schematics showing the initial conditions of simulations from top-down view (left) and orthogonal view (right). The initial length of active zone (blue) is set at 500 nm. The width of F-actin band (purple) is set at 50 nm. Here, the active zone refers to the actin-free membrane area that includes not only the vesicle fusing area but also the endocytic zone. In contrast, the periactive zone is represented by the F-actin band where actin cortex impinges upon the membrane. The center of the active zone is set as (x, y) = (0, 0). One fusing vesicle (light blue circle) is placed at (0, D), while two other vesicles are placed at (C, -C) and (-C, -C) such that three vesicles would form an isosceles triangle. As the initial condition, we set C = D = 60 nm. e Snapshots from simulations, showing the evolution of membrane curvature within the active zone over time. Three fusing vesicles are organized with C = D = 60 nm. At 58 ms, simulations reach the steady state, with 2 endocytic pits forming at the boundary between active zone and actin-enriched region. f Plot showing the depth of exocytic pits and endocytic pits as a function of time. g (top) Maximal mean curvature of the endocytic membrane pit at maximal pit depth. (bottom) Plot showing the resulting membrane curvature as a function of the spatial arrangement of fusing vesicles. Distances among vesicles are modulated by changing C and D, depicted in d. h (top) Maximal mean curvature of the endocytic membrane pit at maximal pit depth. (bottom) Plot showing the dependence of successful endocytic pit formation on bending moduli of active zone and periactive zone membranes. The colored areas indicate successful formation of endocytic pits. Source data are provided as a Source Data file.

