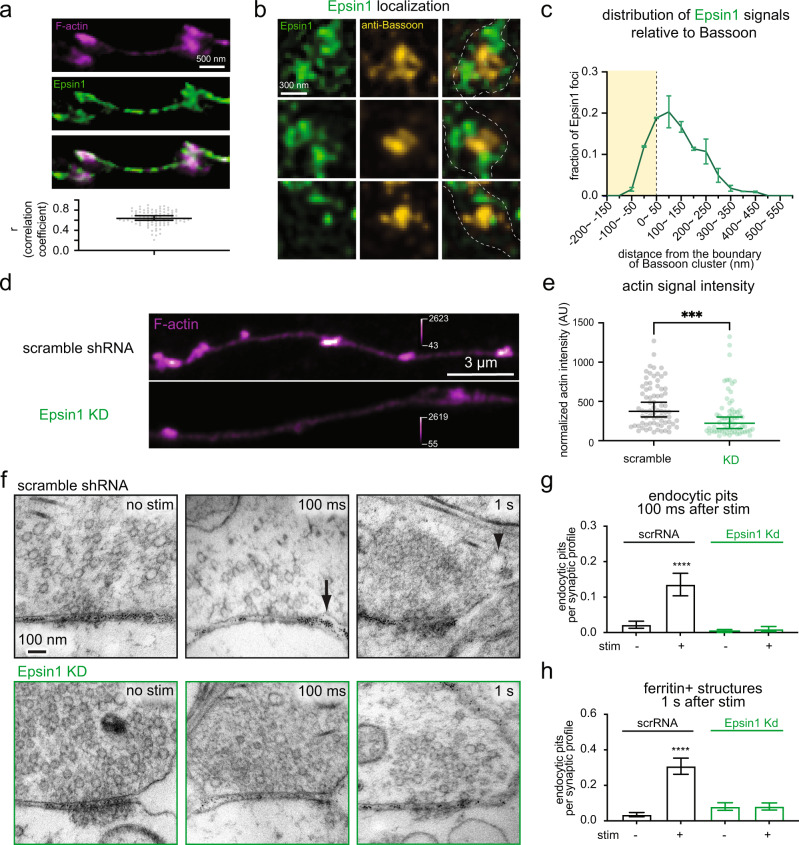
Fig. 4. Epsin1 organizes F-actin at presynaptic terminals and is required for ultrafast endocytosis.
a (top) Example airyscan micrographs showing the localization of Epsin1 relative to F-actin in wild-type neurons. Epsin1 stained with Epsin1-antibody and its secondary antibody conjugated with Atto647N. F-actin is labeled by neuronal expression of EGFP-UtrCH, which is stained by a GFP-antibody and its secondary antibody conjugated to Atto488. (bottom) Plot showing the Pearson’s correlation coefficient. Each dot = synapse. n = 94 synapses. N = 3 cultures. b Example 2D STED micrographs showing the localization of Epsin 1 relative to the active zone in wild-type neurons. Active zone is marked by anti-Bassoon antibody and its secondary antibody conjugated with Alexa594. Epsin1 stained with Epsin1-antibody and its secondary antibody conjugated with Atto647N. c The distribution of Epsin1 signals against the active zone boundary. The active zone boundary was defined by Bassoon signals. See Methods for the analysis method. Error bars are SEM. N = 2 cultures, n = 30–60 per culture. d Example confocal fluorescence micrographs showing F-actin signals in neurons expressing scramble shRNA and Epsin1 knock-down (KD) shRNA. F-actin is stained by expressing EGFP-UtrCH. e The normalized intensity of F-actin signals from neurons expressing scramble (scr) shRNA, or Epsin1 shRNA, measured by Airyscan. Signals are normalized to the fluorescence signals in axons. Kruskal-Wallis test, with Dunn’s multiple comparisons test. ***p < 0.001. See Supplementary Table 2 for the detailed numbers for each sample. f Example electron micrographs showing wild-type and Epsin1 KD synapses unstimulated or stimulated with a single electrical pulse (1 ms) and frozen 100 ms or 1 s later. Black arrow: endocytic pit. Black arrowhead: ferritin-positive endosomes. g, h Number of endocytic pits at 100 ms after stimulation (g) or ferritin-positive structures at 1 s after stimulation (h) in neurons expressing scramble shRNA (scrRNA) or Epsin1 shRNA. Mean and 95% confidential interval are shown. Kruskal-Wallis test, with Dunn’s multiple comparisons test. ****p < 0.0001. p-values are only shown for direct comparison between unstimulated and stimulated neurons treated with the same drug. See Supplementary Table 2 for the detailed numbers for each sample. Source data are provided as a Source Data file.

