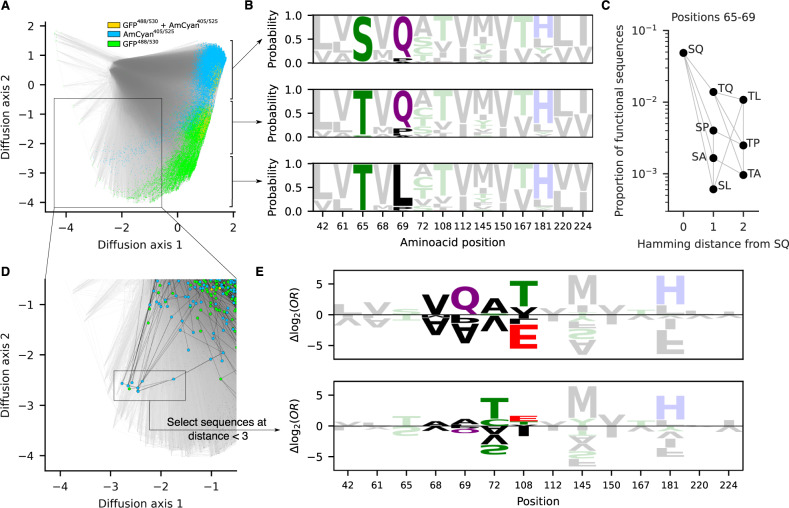
Fig. 4. Global analysis of the GFP genotype-phenotype map shows high mutational contiguity among functional sequences.
A Low-dimensional visualization of the sequence-function relationship predicted by the random forest model (see “Methods”). Functional sequences are highlighted in different colors according to whether they are predicted to fluoresce in the GFP488/530 channel (green), AmCyan405/525 channel (blue), or both (gold). Lines join genotypes that are separated by a single amino acid substitution. B Site-frequency logos of functional sequences based on position along diffusion axis 2 (the three logos correspond to diffusion axis 2 coordinates greater than −0.5, between −0.5 and −2.25, and less than −2.25). C The proportion of functional sequences changes depending on the amino acids at positions 65 and 69. Gray lines indicate single amino acid substitutions. D Close-up of the region containing a cluster of observed sequences with unusual sequence properties. Highlighted dots indicate sequences that were directly characterized as functional in the high-throughput experiments, and black lines indicate single amino acid substitutions between these experimentally characterized sequences (see Supplementary Fig. 9 for a visualization of all sequences enriched in the high-throughput experiment). E Sequence logo representing the coefficients of the logistic regression models trained on random forest predictions to identify changes in allelic preferences when using all sequences for training (top) or only sequences within two mutations of the genotypes highlighted in (D) (bottom). Coefficients are expressed as additive allelic contributions (i.e., Δlog2 odds ratios) that have been mean-centered by site. Data are provided as a Source Data file.

