
Fig. 5.
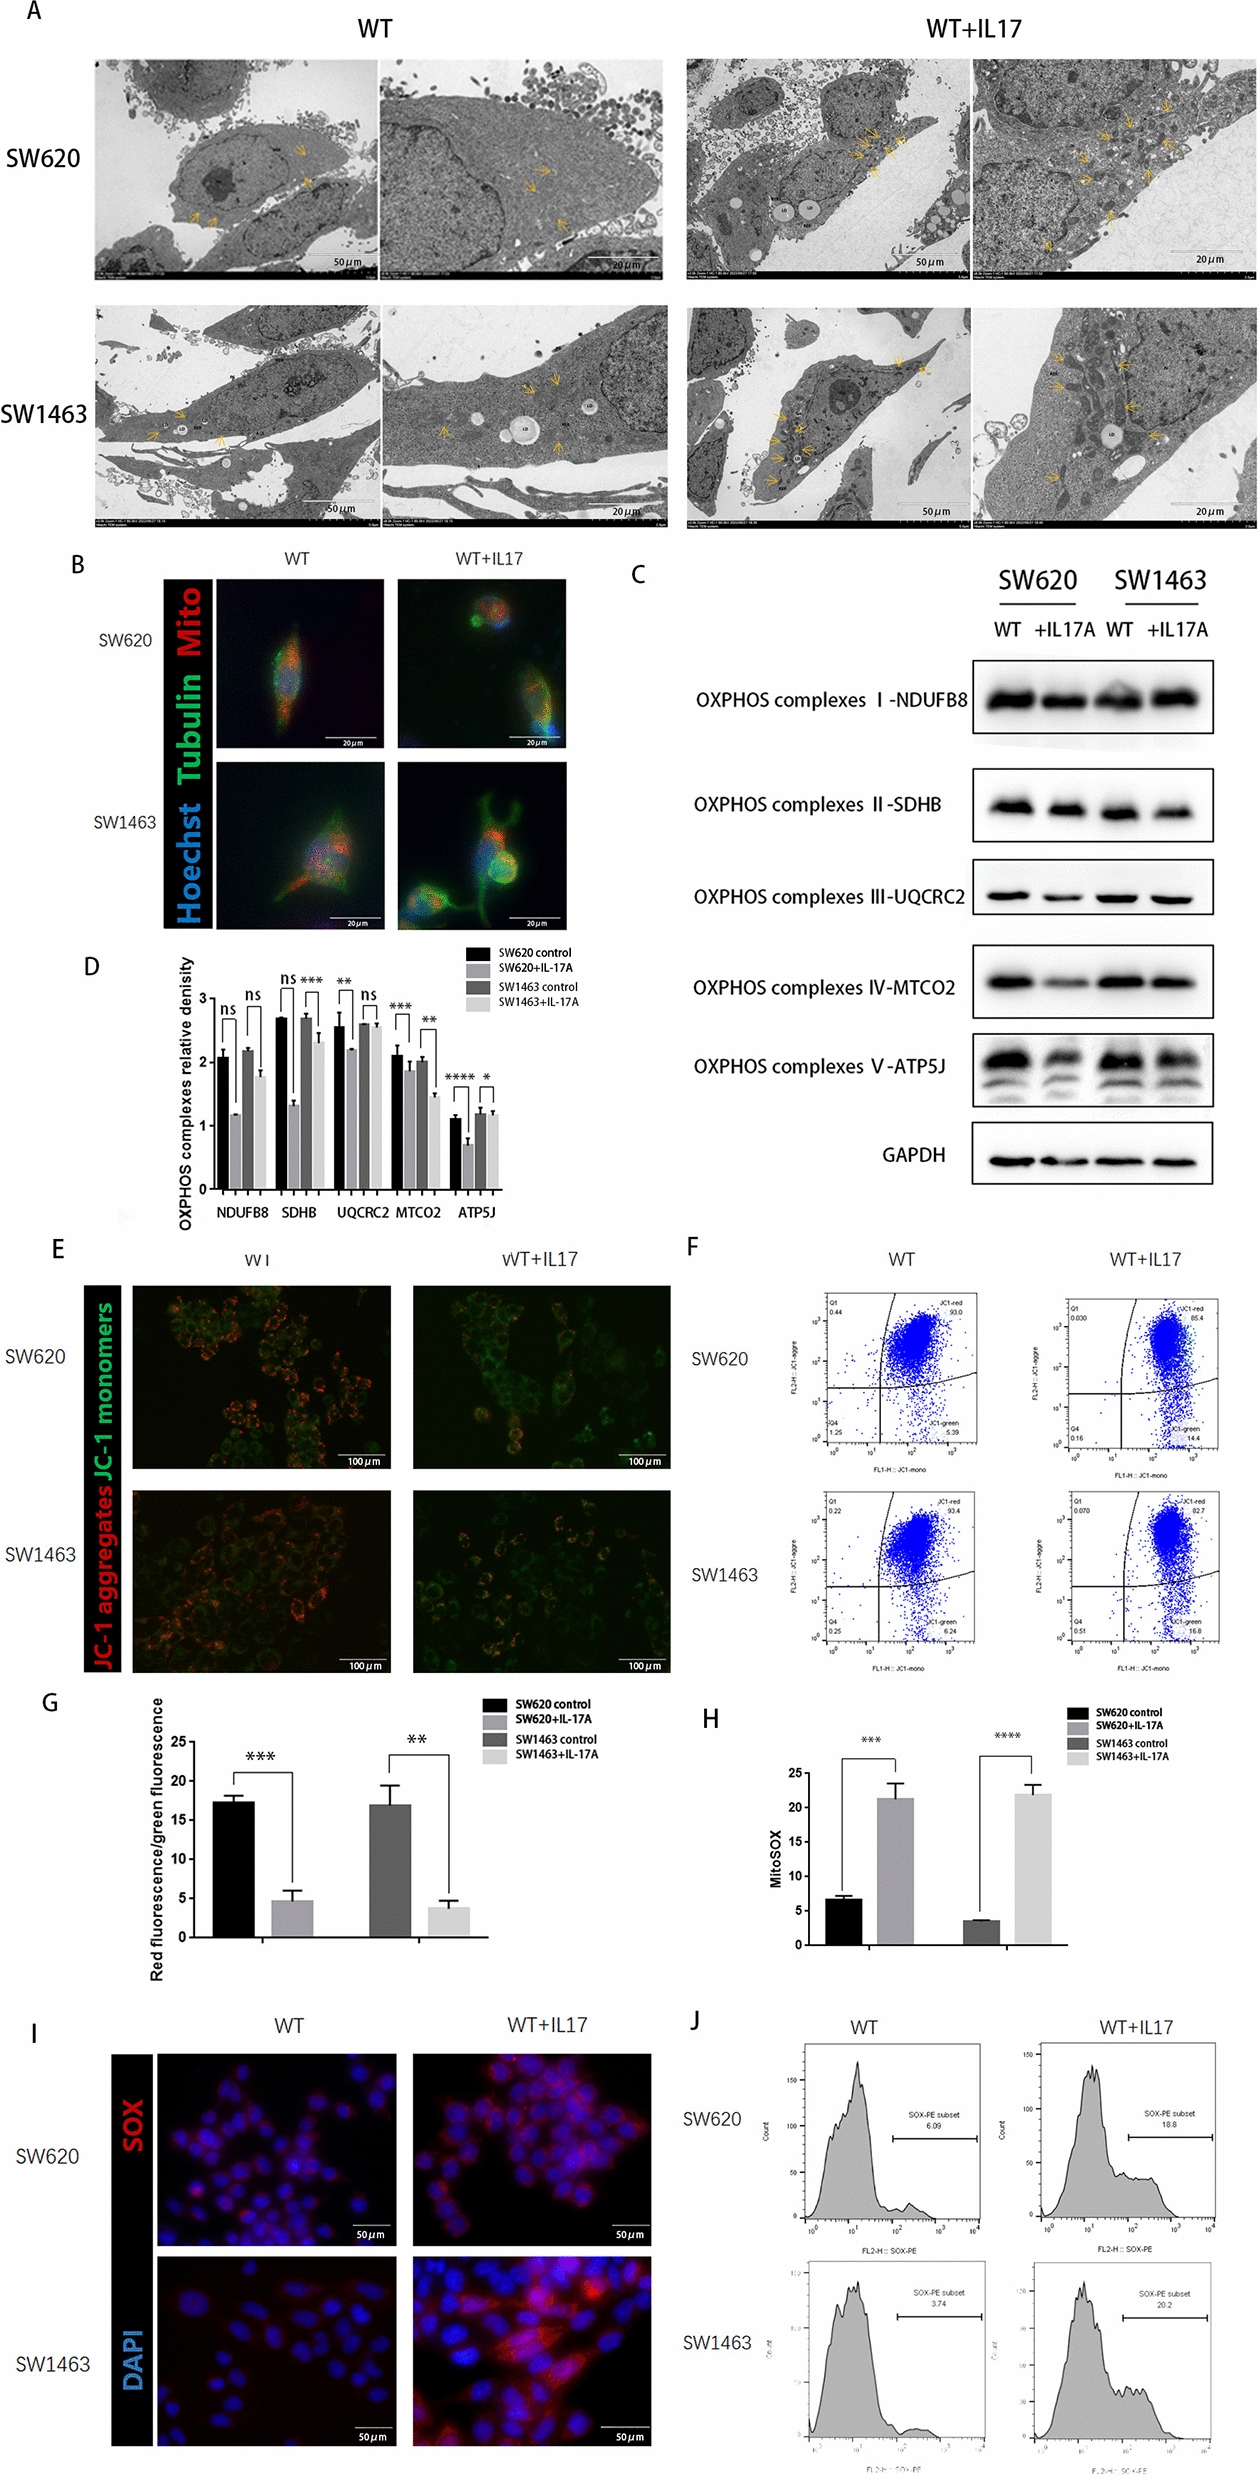
Mitochondrial dysfunction increases in CRC cells by treatment with IL-17A. A Transmission electron microscopy of CRC cells after treatment with IL-17A.Arrowheads indicate mitochondria; B CRC cells after treatment with IL-17A were immunostained with Mito-Tracker (red), anti-α-tubulin (green), and DAPI (nuclei, blue); C, D The expression of OxPhos complex subunits in CRC cells after treatment with IL-17A was analysed by western blotting, data conforms to normal distribution, and tested by two independent samples t-test. The mitochondrial membrane potential was measured using JC-1 dye. E representative microscopic and (F-G) flow cytometry analysis and quantitation, data conforms to normal distribution, and tested by two independent samples t-test. Immunostained for the Mitochondrial Superoxide Indicator with Mito-SOX. H representative microscopic and I-J flow cytometry analysis and quantitation, data conforms to normal distribution, and tested by two independent samples t-test