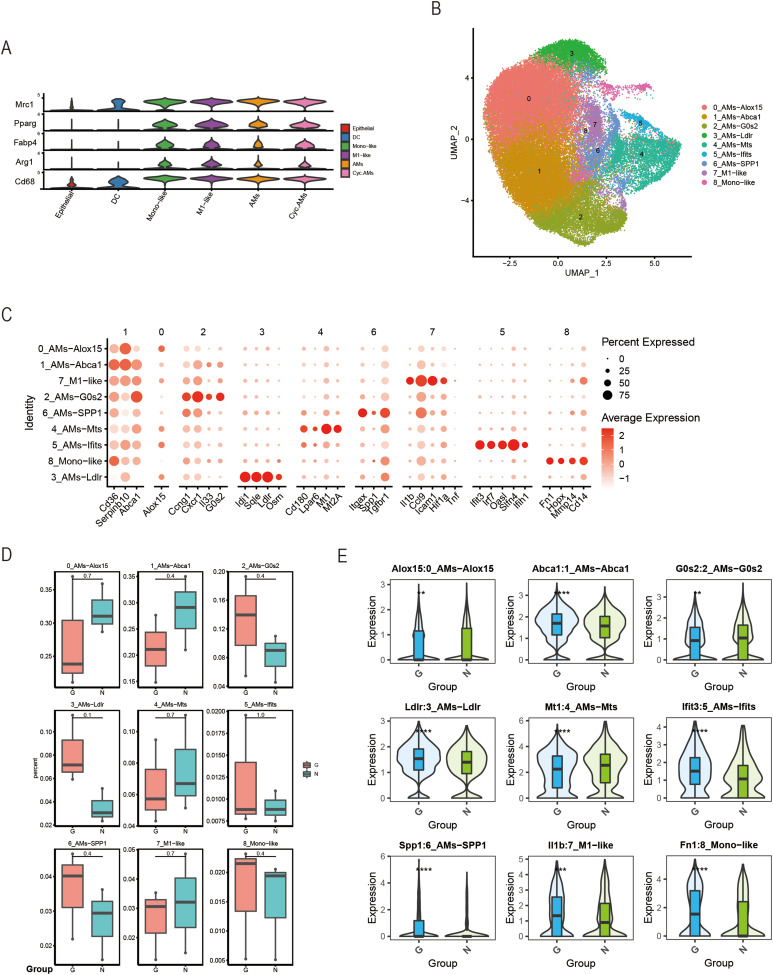
Figure 3.
Analysis of macrophage subpopulations. (A) Violin plots of normalized expression values for canonical cell-specific marker genes for AM clusters. (B) ScRNA-seq represented the integrated UMAP along with the individual sample distribution. (C) Dot plot showing the gene expression levels in each sub-cell type, with brightness indicating the log-normalized average expression and circle size indicating the expression percentage. (D) Percentage bar graph showing the distribution of cell types in each sample. (E) Violin plots indicating between-group differences in the expression levels of canonical markers. The p-values are calculated using a two-sided Wilcoxon signed-rank test from a theoretical null distribution. (**P < 0.005, ***P < 0.001, ****P < 0.0001).
Abbreviations: AM, alveolar macrophage; UMAP, uniform manifold approximation and projection.

