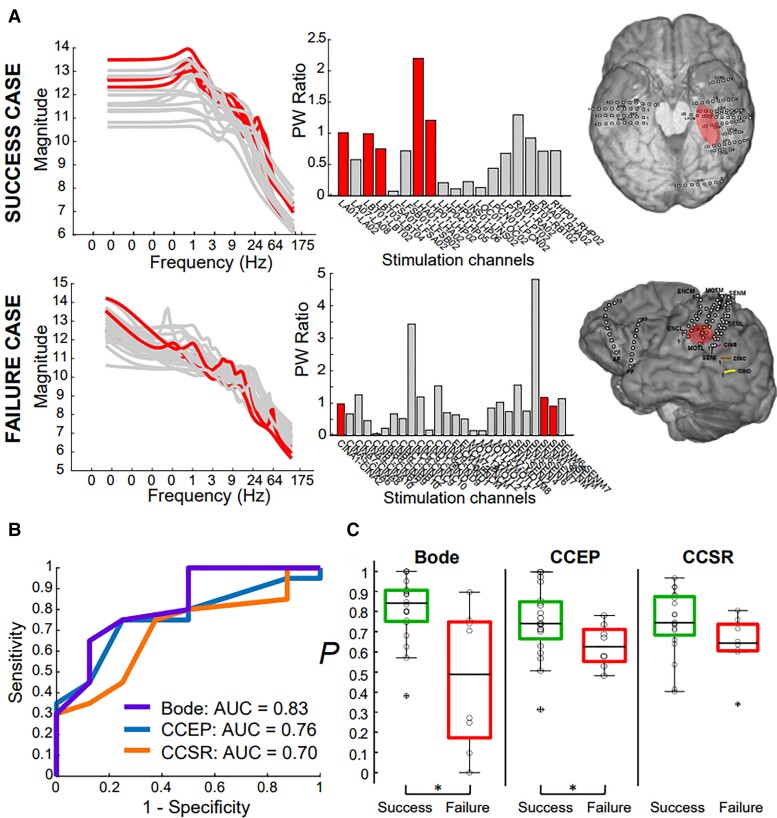
Figure 4.
Bode plots and PW ratios reflect surgical outcome. (A) Representative patients with successful (P017, top) and failed (P011, bottom) surgical outcomes. The left and middle panels show the Bode plots and PW ratios for all stimulated channel pairs, respectively, and the right panel shows the SOZ location for both patients. (B) ROC analysis finds Bode features superior in discriminating successful and failed outcomes. Best Bode model included PW ratio and the DC gain as features with an AUC of 0.83; the best CCEP model included Z-scores from N2 and N1 amplitudes and had an AUC of 0.76; best CCSR model included theta, alpha and beta frequency bands with an AUC of 0.70. (C) The probability values for individual patients were significantly greater for surgical successes (green box plots, left box for each model) compared with failures (red box plots, right box for each model) in both Bode and CCEP models, but insignificantly greater in the CCSR model.

