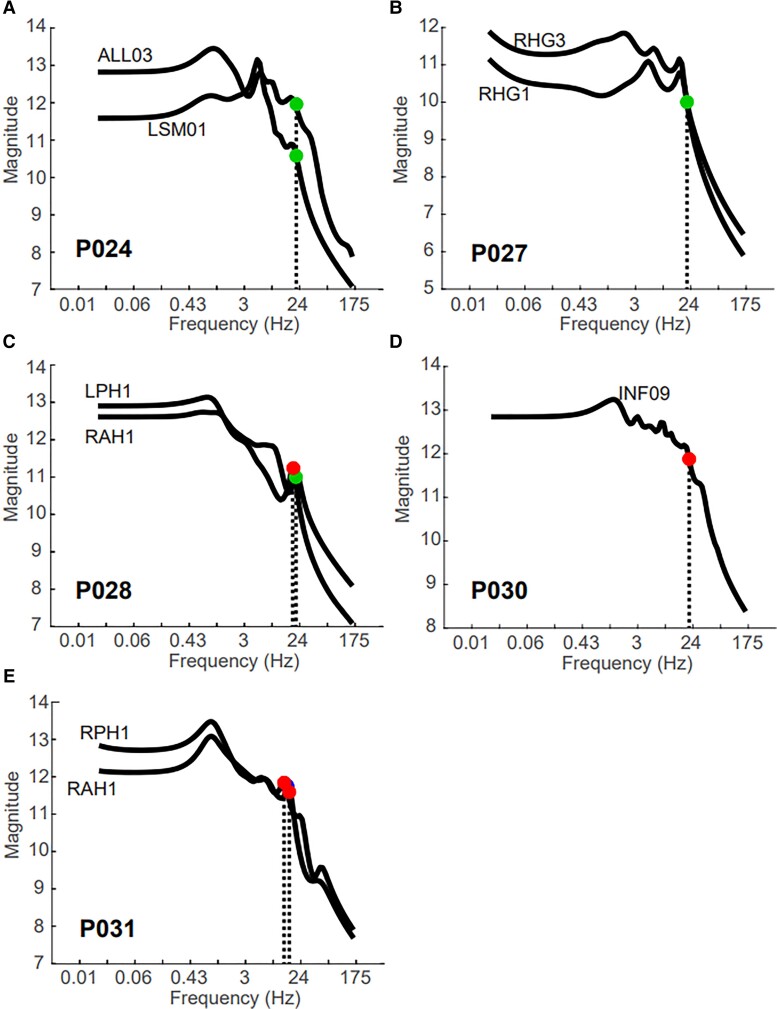
Figure 6.
Seizures are prospectively stimulated in patients with corresponding resonant peaks in Bode plot. The black line shows the Bode plot for each stimulation pair and labelled with the first stimulation channel name for (A) P024, marked a true positive; (B) P027, marked a false negative; (C) P028, a true positive; (D) P030, a false negative and (E) P031, a true positive. The circles indicate the frequency of periodic stimulation that elicited a seizure (red) or aura (green).

