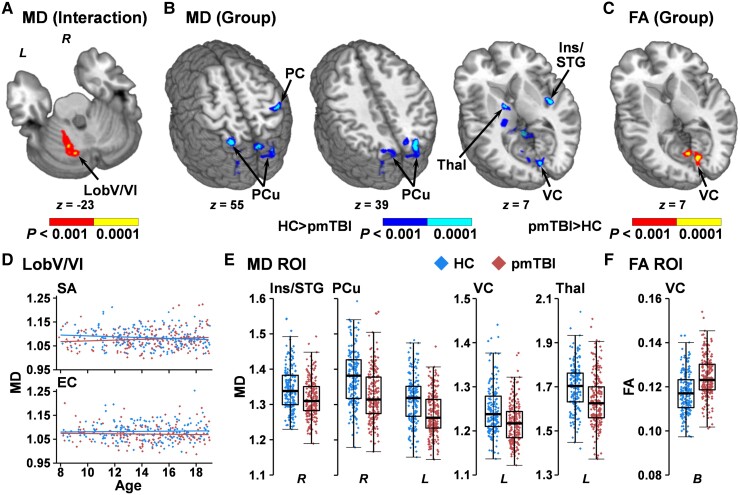
Figure 2.
Voxel-wise analyses of traditional dMRI metrics. Results from the analysis of MD and FA for patients with pmTBI (red diamonds) and HC (blue diamonds). (A) A cluster within the left cerebellar Lobule V/VI that exhibited a Group × Visit × Age interaction (red: P < 0.001; yellow: P < 0.0001) for MD. Plotted data (D) indicate a significant negative association between residualized MD and age at the SA visit for HC, which was not significant at the EC visit. (B) The regions that demonstrated main effects of Group for MD (HC > pmTBI) are displayed in cool colours (dark blue: P < 0.001; cyan: P < 0.0001), with (E) presenting box-and-scatter plots [elements: median, interquartile range (IQR) and 3 × IQR or local maxima/minima) for selected regions of interest (ROIs) [post-central gyrus (PC), precuneus (PCu), insula extending into superior temporal gyrus (Ins/STG), visual cortex (VC), and thalamus (Thal)] for both right (R) and left (L) hemispheres. (C) The bilateral (B) VC was associated with increased FA for pmTBI (red: P < 0.001; yellow: P < 0.0001), with (F) presenting the box-and-scatter plot. Locations of the axial (z) slices for all panels are given according to the Talairach atlas.

