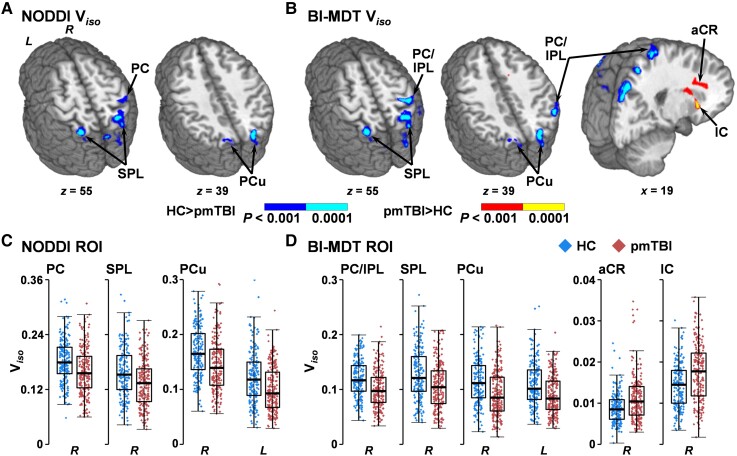
Figure 3.
Voxel-wise analyses of Viso. This figure presents the main effect of Group from analyses of isotropic volume fractions (Viso) using either the standard NODDI algorithm (A and C) or a biologically informed MDT algorithm (BI-MDT; B and D). Data for patients with paediatric mild traumatic brain injury (pmTBI) (red diamonds) are plotted with warm colours in all panels, with HC (blue diamonds) data plotted with cool colours. Locations of sagittal (x) and axial (z) slices are given according to the Talairach atlas in the left (L) and (R) hemispheres. Both NODDI (A) and BI-MDT (B) indicated a main effect of group for regions of decreased Viso (HC > pmTBI) in predominantly GM regions [post-central gyrus (PC),inferior (IPL) and superior (SPL) parietal lobule, precuneus (PCu)] for pmTBI relative to HC (dark blue: P < 0.001; cyan: P < 0.0001). In contrast, only the BI-MDT model was sensitive to regions of increased WM Viso [anterior corona radiata (aCR) and the internal capsule (IC) extending into putamen] for pmTBI (red: P < 0.001; yellow: P < 0.0001). (C and D) Box-and-scatter plots [elements: median, interquartile range (IQR), and 3 × IQR or local maxima/minima] for selected regions of interest (ROI) for each metric.

