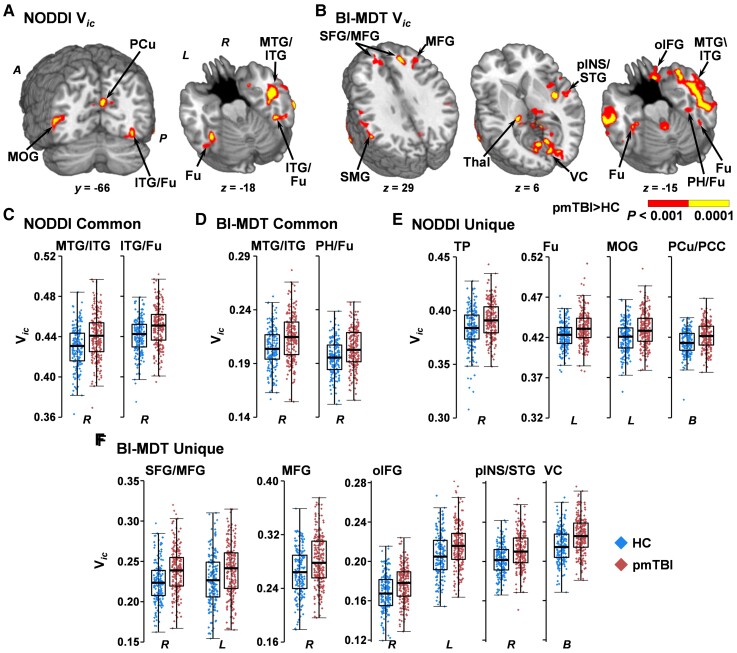
Figure 4.
Voxel-wise analyses of Vic. Results from analyses of Vic using either the standard NODDI (A) or a biologically informed MDT algorithm (BI-MDT; B) for the main effect of Group. Locations of coronal (y) and axial (z) slices are given according to the Talairach atlas in anterior (A) and posterior (P) positions in the left (L) and (R) hemispheres. Both models demonstrated increased Vic (red: P < 0.001; yellow: P < 0.0001) for patients with pmTBI (red diamonds) relative to HC (blue diamonds), although findings were more extensive in the biologically informed model. NODDI (C) and BI-MDT (D) box-and-scatter plots [elements: median, interquartile range (IQR) and 3 × IQR or local maxima/minima] for common regions of interest, including the middle and inferior temporal gyrus (MTG/ITG) and the fusiform gyrus (Fu) extending into parahippocampal gyrus (PH) or ITG. (E) Exemplar regions unique to the NODDI algorithm including the temporal pole (TP), middle occipital gyrus (MOG) and bilateral (B) precuneus and posterior cingulate (PCu/PCC). (F) Exemplar regions unique to the BI-MDT algorithm, including superior and middle frontal gyrus (SFG/MFG), the MFG alone, orbital aspect of the inferior frontal gyrus (oIFG), posterior insula and superior temporal gyrus (pINS/STG) and visual cortex/cuneus (VC). There were many other significant regions of interest from the BI-MDT analysis (Supplementary material) that are displayed [e.g. supramarginal gyrus (SMG), thalamus (Thal)] but not plotted.

