Figure 6.
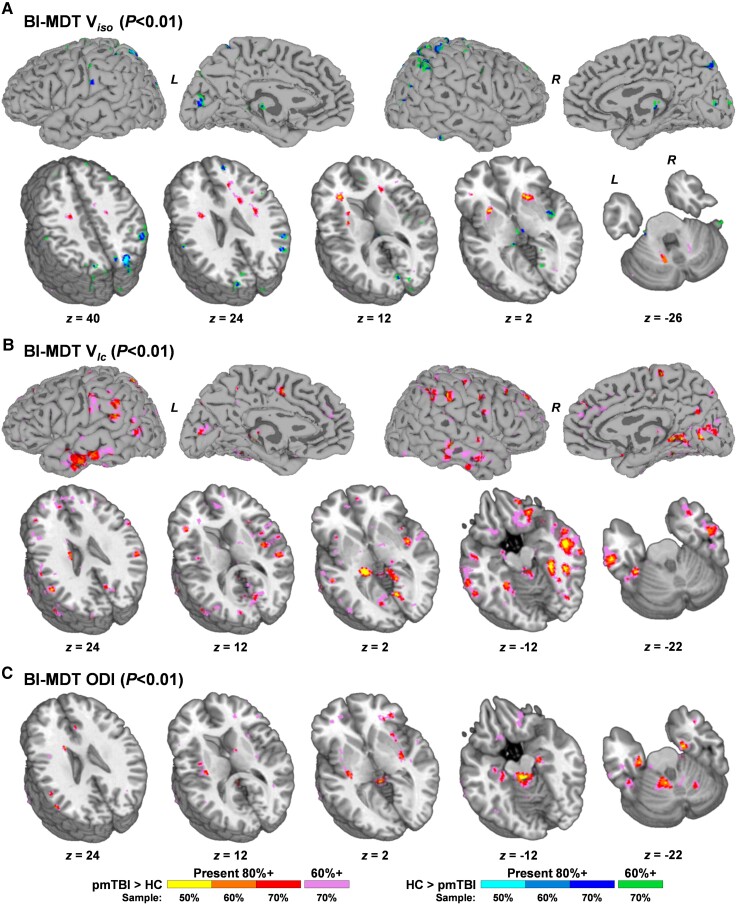
Cross-validation of multicompartmental model results. Results from cross-validation analyses of Viso (A), Vic (B) and ODI (C) data from the biologically informed MDT (BI-MDT) algorithm at 50, 60 and 70% of the total sample size (sampled without replacement; 300 iterations). For each metric, a statistical threshold (uncorrected P < 0.01) was applied to main effect of Group for each iteration on a voxel-wise basis. Active voxels were then summed across iterations and divided by the number of iterations to form percentage values. Voxels demonstrating main effects are colour-coded by both direction of effect (paediatric mild traumatic brain injury (pmTBI) > HC = warm; HC > pmTBI = cool) and level of reproducibility. In the first step, voxels were colour-coded for each sample size where a minimum of 80% reproducibility was achieved (50% of sample: yellow or cyan; 60% of sample: orange or middle blue; 70% of sample: red or dark blue). In the second step, voxels that achieved a minimum of 60% reproducibility at 70% of the total sample size were denoted (pink or green colours). Data are both projected to the surface and displayed for selected axial slices (z; see Figs 3–5) according to the Talairach atlas for Vic and Viso, whereas results are presented in volume format only for ODI due to limited GM involvement.

