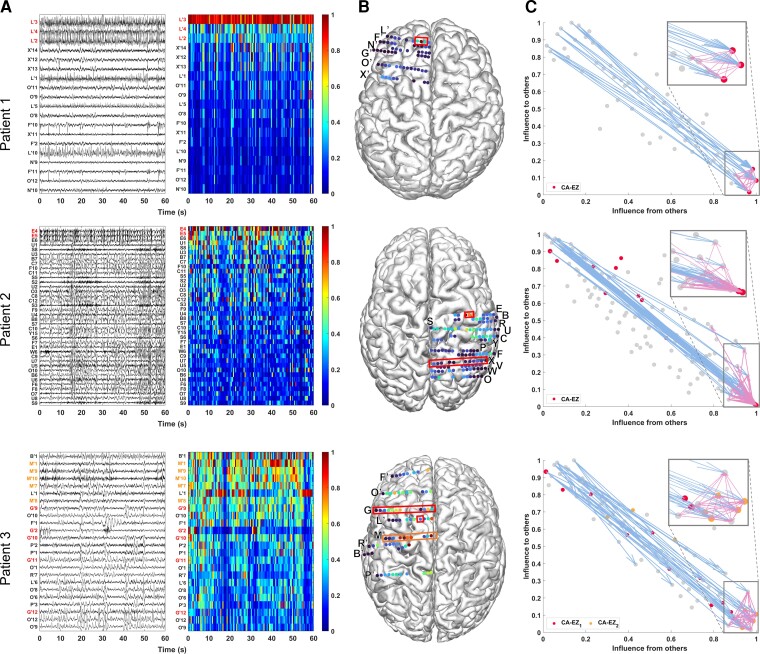
Figure 3.
Three patient examples. Patient 1 (top) had a successful surgical outcome. Patient 2 (middle) had a failed surgical outcome. Patient 3 (bottom) had two surgeries. After the first surgery, the patient continued to have seizures (failed outcome) but became seizure-free (successful outcome) after the second surgery. (A) A 1-min interictal iEEG snapshot (left) and the resulting SSI (computed as the product of the three SSMs) of every channel (right). Channels are arranged from highest to lowest average interictal SSI. CA-EZ channels are coloured red. For Patient 3, the CA-EZ from the second surgery is coloured orange. Only the top 30% of channels are shown for better visualization purposes, and all channels not shown have low SSI values. In Patient 1 (top), CA-EZ channels had the highest SSI values, whereas only 2 of 13 CA-EZ channels had a high SSI in Patient 2 (middle). In Patient 3 (bottom), the CA-EZ that rendered the patient seizure-free had the highest SSI values. (B) Average SSI of each channel overlaid on the patients’ implantation maps. Red/orange boxes outline CA-EZ channels. (C) 2D source-sink space. Top sources are located in the top left and top sinks in the bottom right. CA-EZ channels are coloured red. The second CA-EZ in Patient 3 is coloured orange in the bottom panel. The blue and pink arrows indicate the strongest connections from the top sources and sinks, respectively, and the channels they point to. The most influential connections from sources (blue arrows) point to the sinks and the strongest connections from sinks (pink arrows) point to other sinks in Patient 1 (top), whereas the top sources point to nodes other than top sinks in Patient 2 (middle). Top sinks also point to these other nodes.

