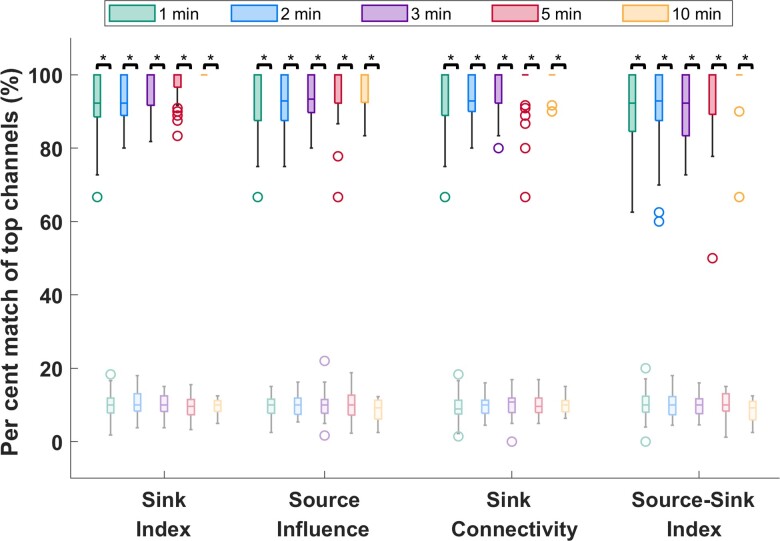
Figure 4.
Temporal stability of the source-sink metrics. Darker colours represent distributions of SSMs, whereas lighter (transparent) colours represent channels captured by chance. On average, over 90% of channels are captured for all metrics, independent of the timing or duration of the interictal snapshot selected. Increasing the window size does not significantly change the percentage of top channels captured. In comparison, only around 10% of top channels are captured by chance. The asterisks indicate a statistically significant difference.

