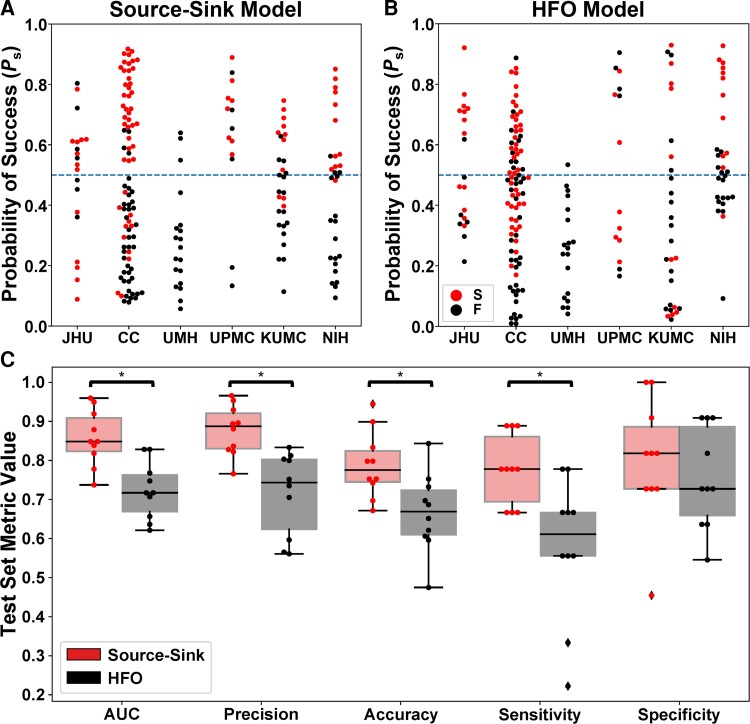
Figure 5.
Performance of the source-sink and HFO metrics in predicing surgical outcomes. (A) Predicted probability of success (Ps) using the source-sink model across all CV folds. Each dot represents one patient and dots are colour-coded by surgical outcome. S = success, F = failure. Note that Ps-values from all 10 CV folds are shown, resulting in more data-points than the number of patients used in the study. The dashed line represents the decision threshold applied to Ps to predict outcomes. For the source-sink model, the majority of patients with a successful outcome (red dots) had Ps-values above the threshold, whereas patients with a failed outcome (black dots) generally had Ps-values below the threshold. (B) Predicted probability of success (Ps) using the HFO model across all CV folds. For the HFO model, there was no clear separation between the patients with successful or failed outcomes, with both groups having Ps-values above and below the decision threshold, thus resulting in lower prediction accuracy. (C) Performance comparison of the SSMs (red) to HFO rate (black). Boxes show distributions of each metric across the 10 CV folds. The asterisks indicate a statistically significant difference. The SSMs outperformed the HFO rate with significantly higher AUC, accuracy, average precision and sensitivity. The SSMs had an AUC of 0.86 ± 0.07 compared with an AUC of 0.72 ± 0.07 using the HFO rate. The source-sink model also outperformed HFOs in terms of average precision, which weighs the predictive power in terms of the total number of patients, with an average precision of 0.88 ± 0.06 compared with 0.72 ± 0.11 for the HFO rate. Using the SSMs, a threshold of α = 0.5 applied to Ps for each subject rendered a test-set accuracy of 78.9 ± 8.5%, compared with a considerably lower accuracy of 66.6 ± 10.1% using HFOs and an even lower clinical success rate of 43% in this dataset. The biggest performance difference between the two models was in terms of sensitivity (true positive rate), where the SSMs outperformed the HFO rate by 35%, with a sensitivity of 0.78 ± 0.09. However, both models performed similarly in predicting failed outcomes correctly, where the source-sink model had a marginally higher specificity of 0.80 ± 0.16 compared with 0.75 ± 0.13 for the HFOs.

