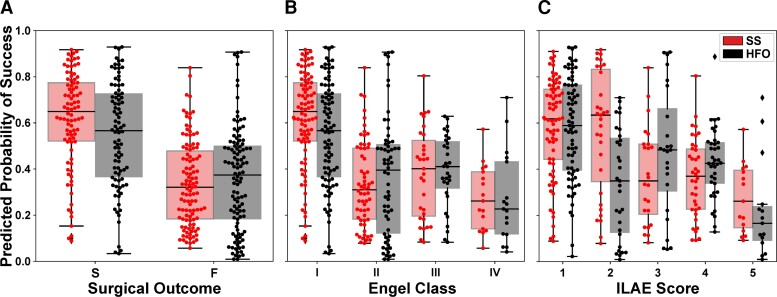
Figure 6.
Predicted probability of success categorized by surgical outcomes. (A) Distributions of Ps as predicted by the source-sink model (red) and HFO model (black). Each box represents the distribution of Ps-values across all 10 CV folds. There was a clear separation between the distributions of patients with successful versus failed outcomes for the SSM model, whereas the distributions obtained using the HFO rate overlapped, and consequently the predictive power of the HFO rates was lower. (B) Distributions of Ps stratified by Engel Class (Engel I = successful outcome; Engel 2–4 = failed outcome). For the SSMs, there was a general trend of decreasing Ps-values as the Engel class (and thus also severity of surgical outcome) increased. In contrast, this did not hold for the HFO rate. (C) Distributions of Ps stratified by ILAE scores (ILAE 1–2 = successful outcome; ILAE 3–5 = failed outcome) followed a similar trend to those observed for the Engel class in B. F = failed surgical outcome; S = successful surgical outcome.

