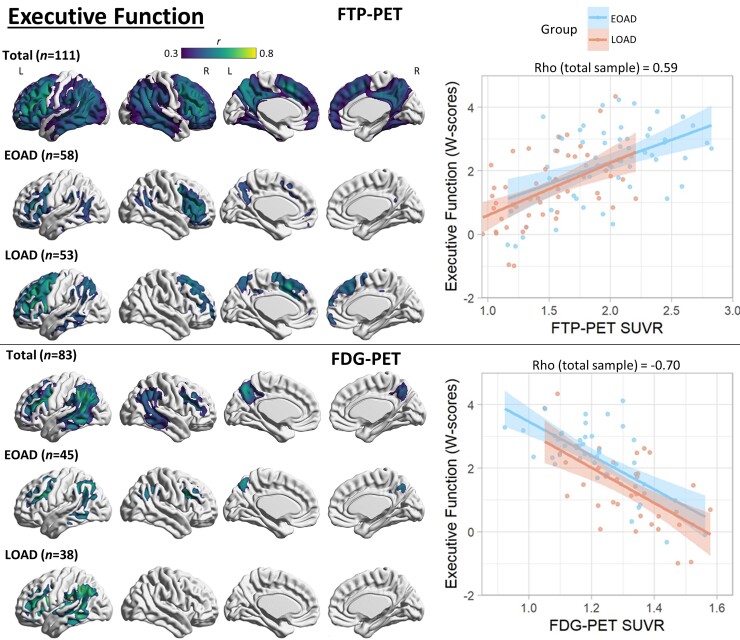
Figure 5.
Voxel-wise correlation between executive function and PET neuroimaging. Voxel-wise regression analyses showing correlation between executive function W-scores and each imaging modality for the total sample and for each age group. Pearson correlation coefficients (left) are shown for voxels significant at a peak-level threshold of P < 0.001 uncorrected, cluster-level family-wise error corrected P < 0.05. Scatterplots (right) were obtained by extracting average SUVR values from significant clusters for the total sample, and plotted separately by age group. Higher W-scores indicate more severe impairment.

