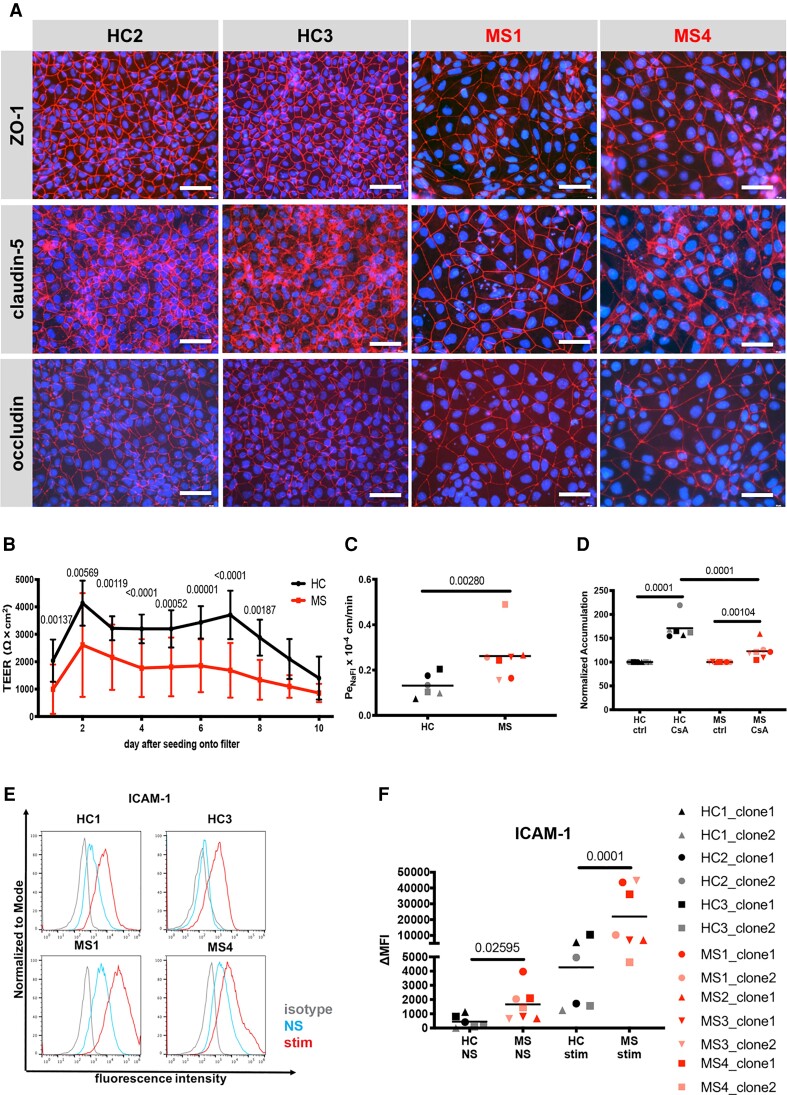
Figure 1.
Morphological and functional differences in MS-patient versus HC-derived DMM-BMEC-like cells. (A) Representative stainings for ZO-1, claudin-5, or occludin (red), and nuclei (DAPI, blue) from Control HC1, Control HC3, Patient MS1 and Patient MS4 are shown. Each staining is representative of at least three independent experiments using three individual differentiations. Scale bar = 50 μm. (B) Transendothelial electrical resistance (TEER) measured with a Volt-Ohm metre. The black line represents mean ± standard deviation (SD) of six clones from three HC and red line represents mean ± SD of seven clones from four MS patients each performed in triplicates and repeated at least twice using two individual differentiations for each donor. (C) Permeability of sodium fluorescein (NaFl) across DMM-BMEC-like cell monolayers was measured. (D) P-gp efflux pump activity was assessed by intracellular accumulation of Rhodamine 123 in the presence or absence of the P-gp inhibitor cyclosporine A (CsA). (E) Cell surface staining for the adhesion molecule ICAM-1 analysed by flow cytometry is shown. Isotype control, non-stimulated (NS) and 16 h pro-inflammatory cytokine-stimulated conditions are shown with the grey, blue and red lines, respectively. Representative data from Controls HC1 and HC3 and Patients MS1 and MS4 are shown from at least two independent differentiations. (F) The change in geometric mean (ΔMFI = MFI staining–MFI isotype) of cell surface ICAM-1 as analysed by flow cytometry. (C, D and F) Bars show the mean of six clones from three HC or seven clones from four MS patients. Each symbol (HC: black, MS: red) represents the mean of at least two independent experiments using two individual differentiations each performed in at least triplicates. Statistical analysis was performed as outlined in the ‘Materials and methods’ section. P-values are indicated in the respective figures.

