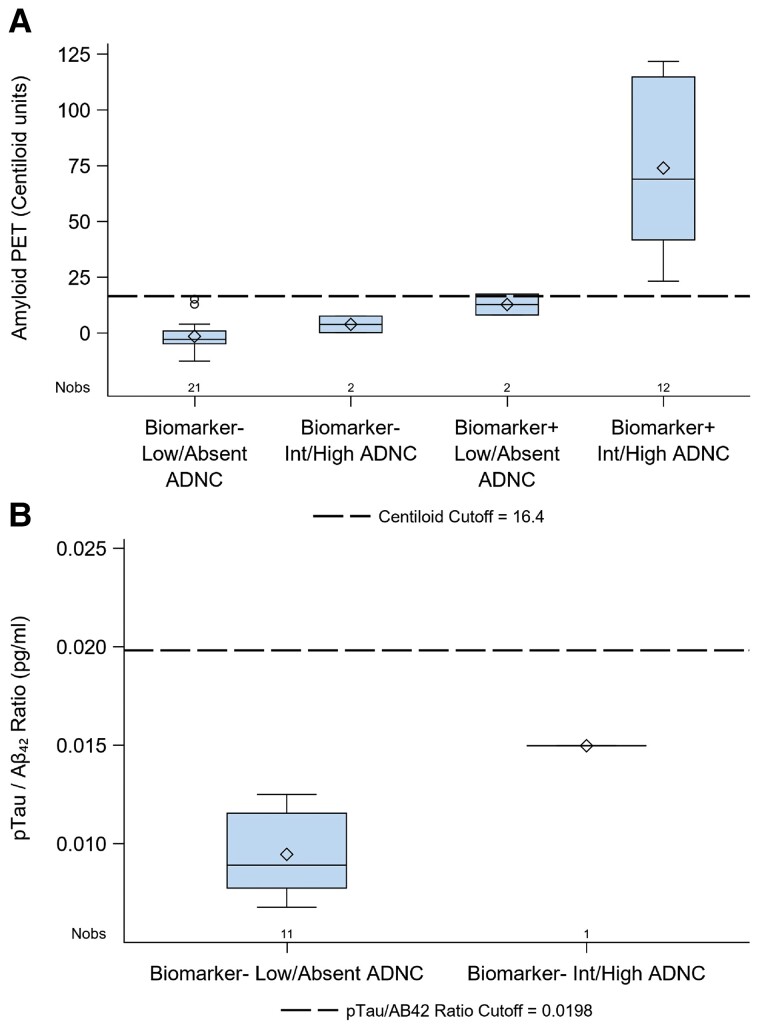
Figure 2.
Baseline biomarker levels in participants stratified by biomarker status and final Alzheimer's disease neuropathological diagnosis. (A) Boxplots of baseline amyloid PET biomarker levels stratified by biomarker positivity and low/absent or intermediate/high ADNC at autopsy. Amyloid PET PIB and AV-45 SUVR measurements were converted to Centiloid units to combine tracer data. Biomarker category assignment was based on SUVR cut-offs. The comparable converted Centiloid cut-off value (16.4) is presented for ease of visualization but was not used as a threshold for biomarker positivity. (B) Boxplots of baseline CSF p-tau181/Aβ42 levels for biomarker-negative participants stratified by low/absent or intermediate/high ADNC at autopsy. Among the participants whose biomarker status was based on CSF, there were no biomarker-positive participants without ADNC in the autopsy cohort. So, biomarker-positive participants were excluded from this plot. In both A and B, the box size defines the interquartile range, the horizontal line indicates the median, the diamond indicates the mean, the whiskers indicate maximum and minimum range of data points and open circles indicate outliers.

