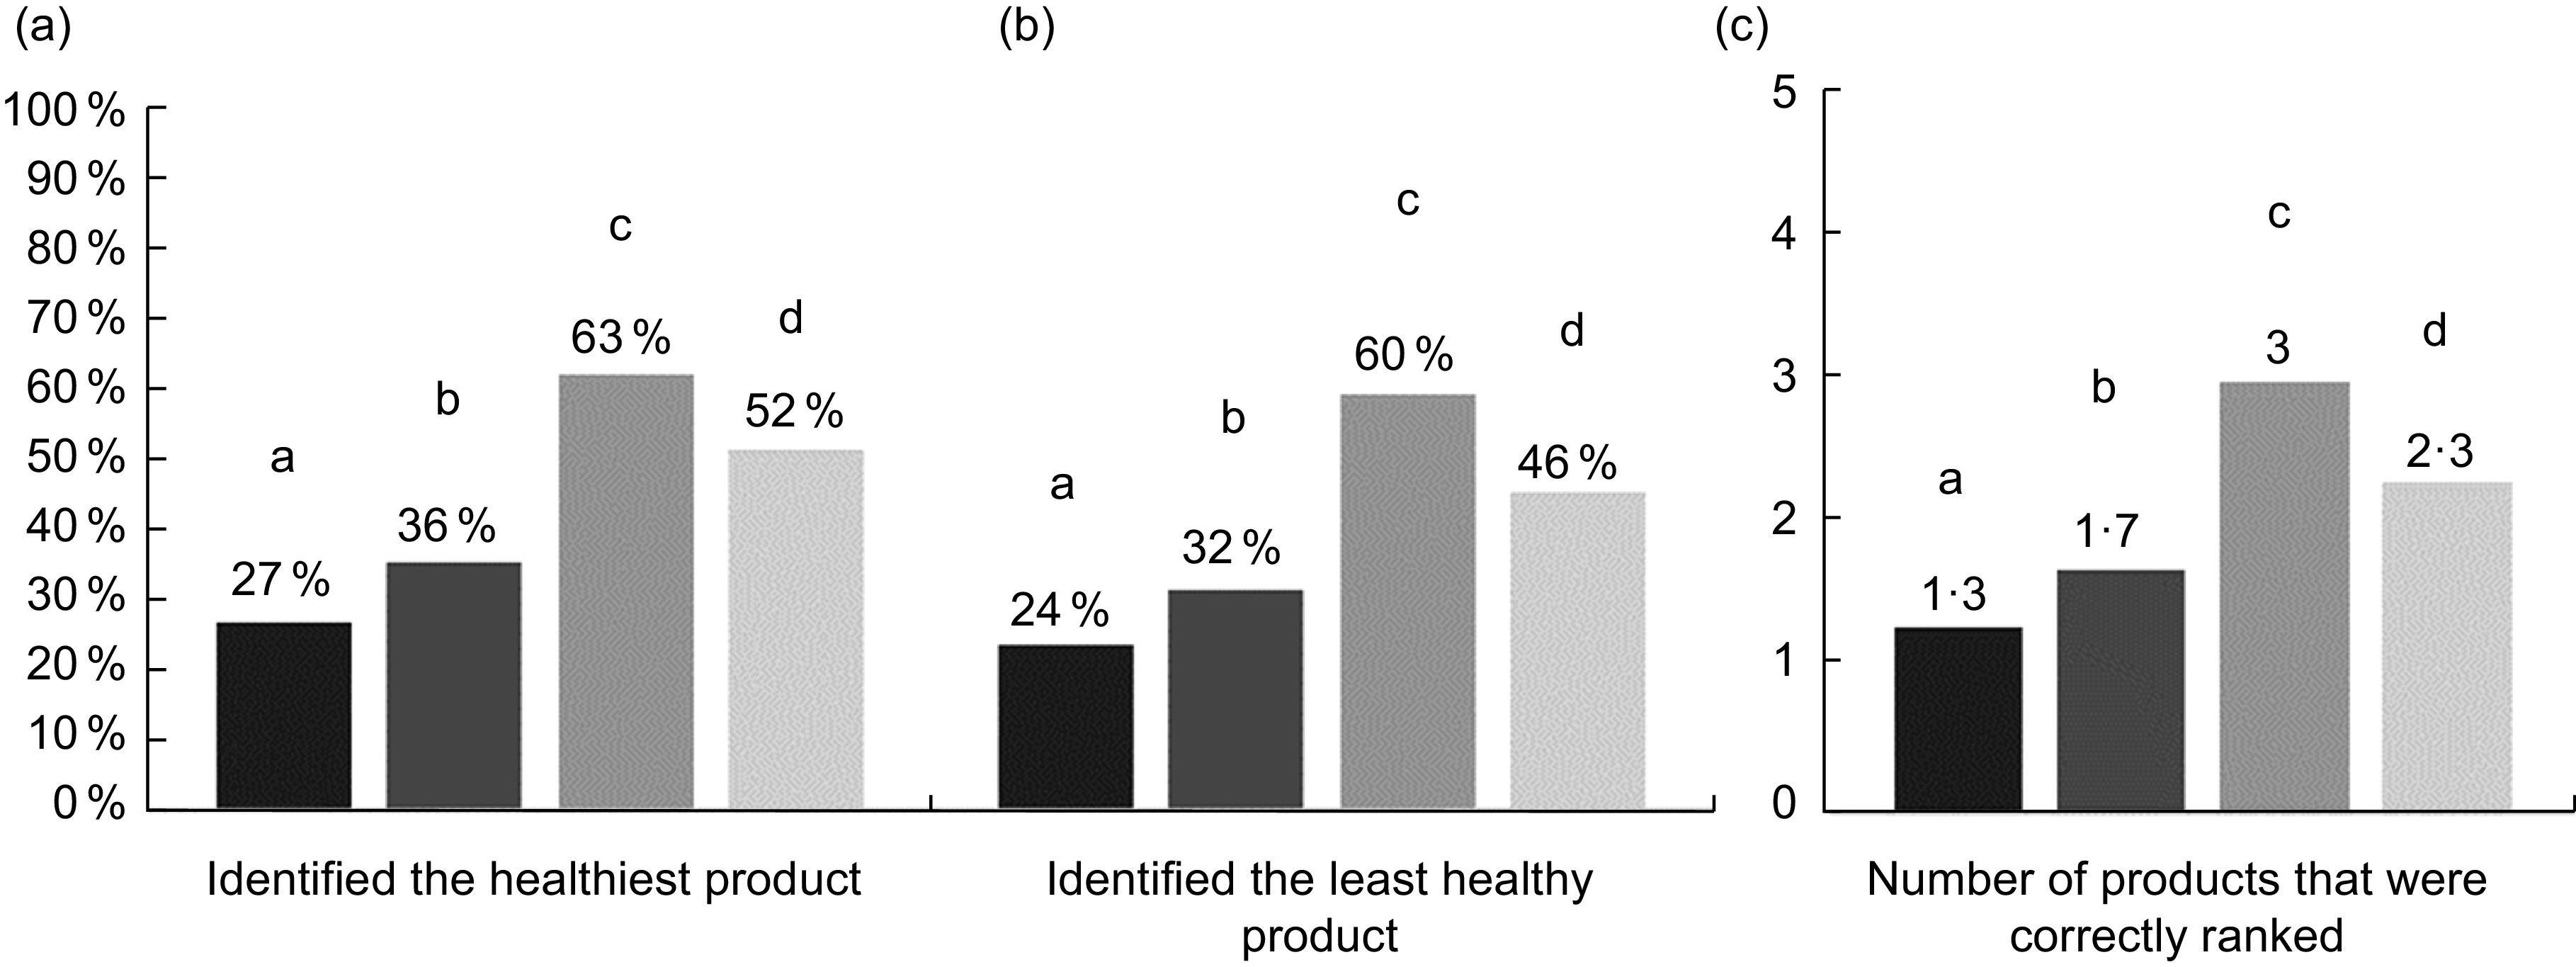
Fig. 5.

Task 2 – The proportion of the sample that (A) correctly selected the healthiest product, (B) correctly selected the least healthy product and (C) the mean number of correct responses in the ranking task.*†
*Values with different letters indicate significant differences (P < 0.05) in repeated measures analysis using logistic regression (A & B) or ordinal logistic regression (C), adjusted for gender, income, education, BMI, ethnicity, healthtpfmt 0literacy and nutrition label use
†Note that figures 5A and 5B represent a proportion, whereas Figure 5C represents the mean number of responses in each of the FOP conditions.
