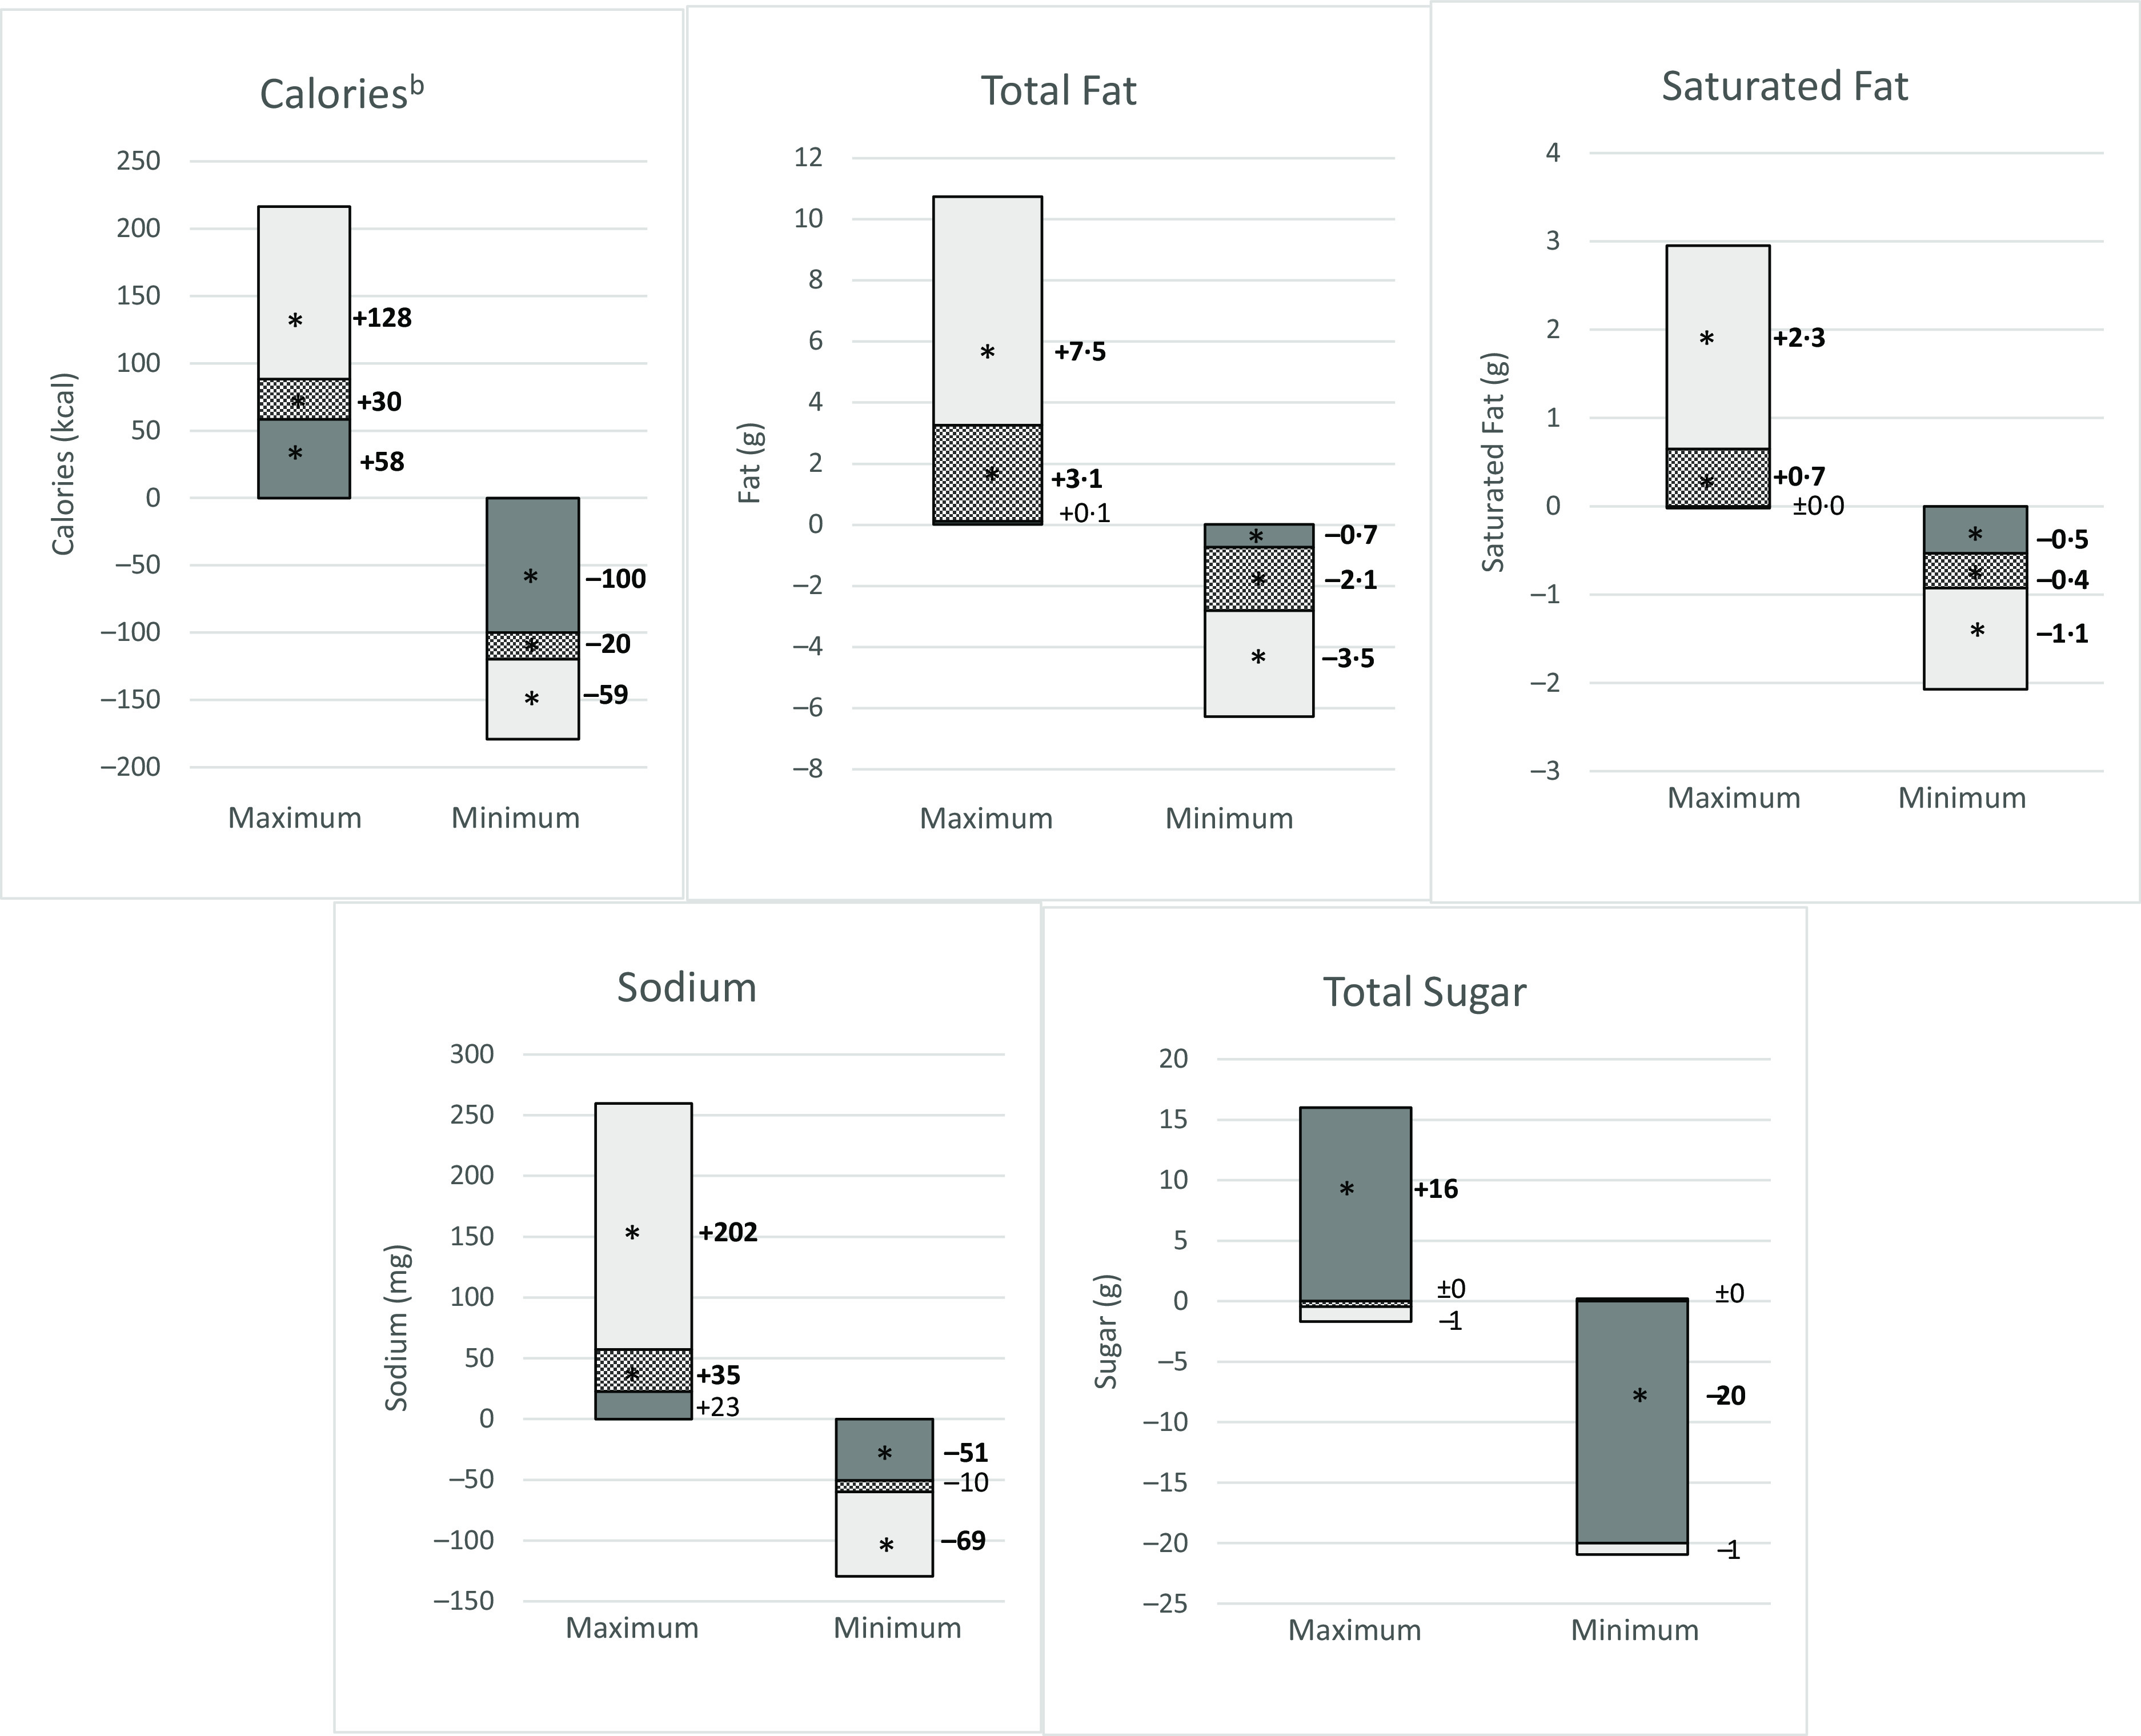
Fig. 1.

Differences in predicted mean nutrient values for default v. maximum and minimum, by meal components (n 252 meals)a
aTwenty-four meals (9 % of the sample: eight default, eight minimum and eight maximum) were excluded from this analysis because nutrition information was only available for the entire meal in MenuStat, precluding our ability to examine how individual meal components drove differences in nutrient values across meal versions. bCalories (i.e. kilocalories; 1 kcal = 4·184 kJ).  , beverage;
  , entrée;
  , side. *Significant difference at P < 0·05.
