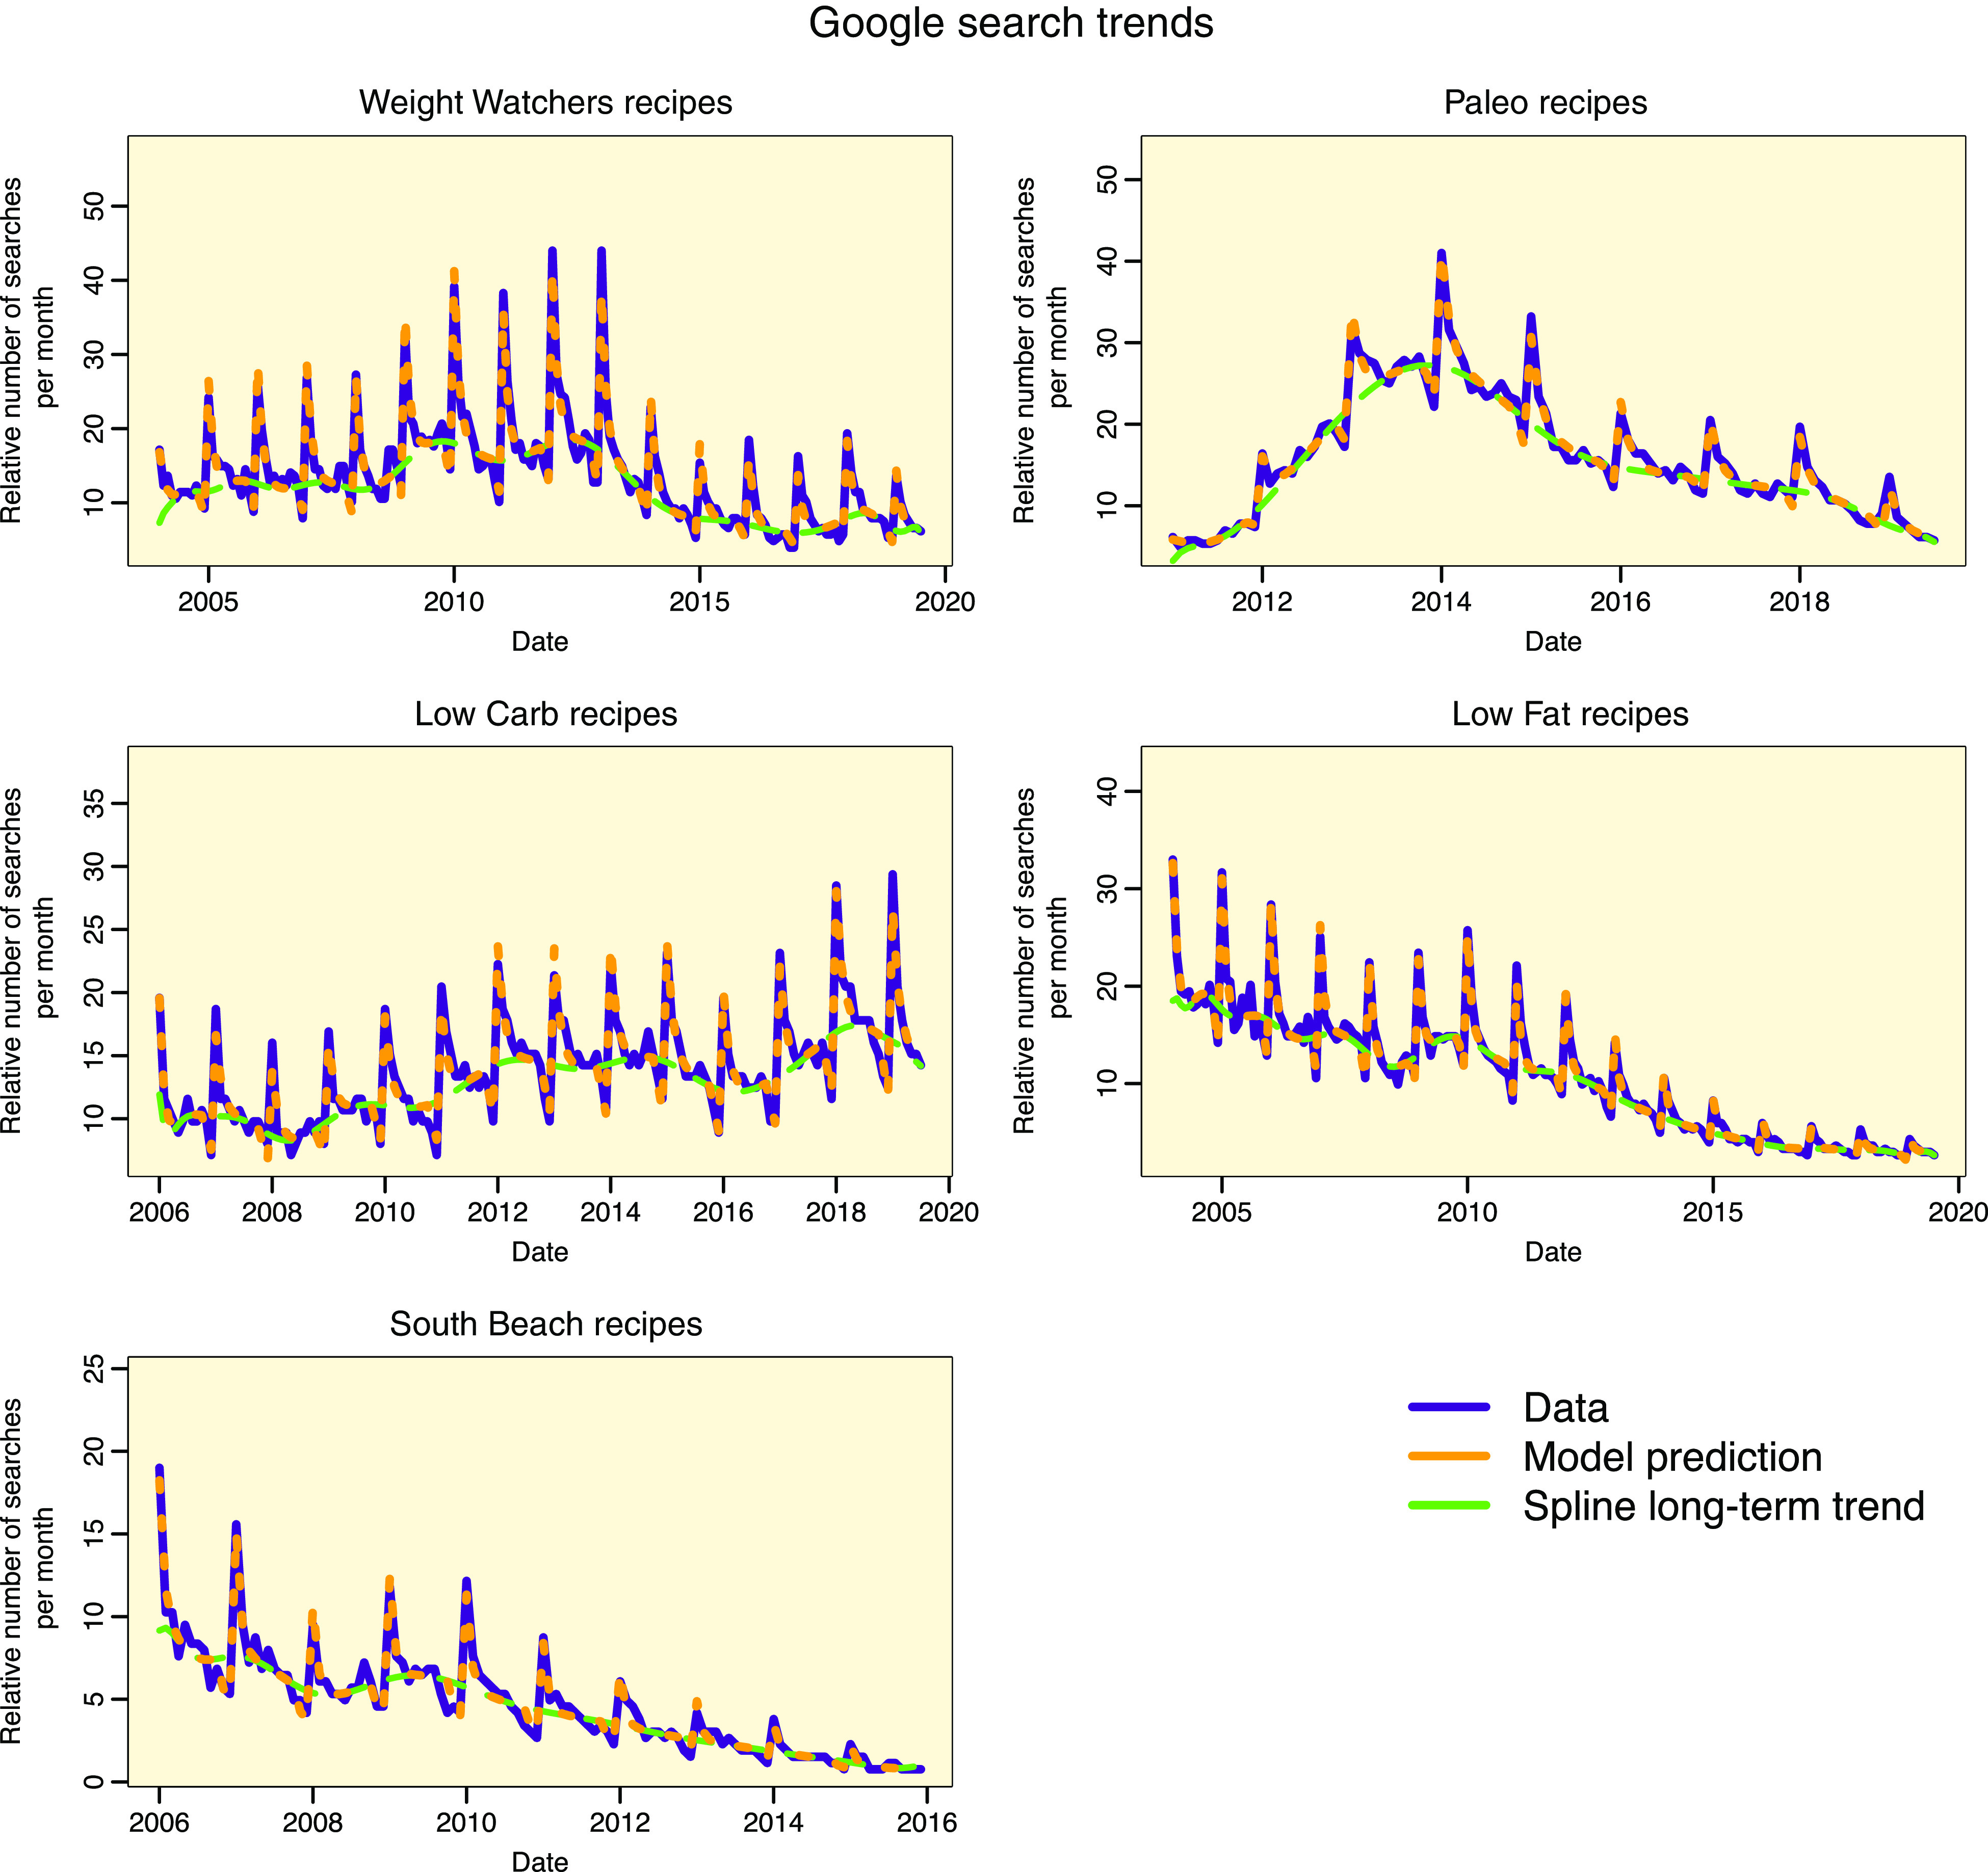
Fig. 4.

Google Trends Internet search data for keyword search terms related to recipes for diets. The monthly number of searches for all keywords is normalised to the maximum number of monthly searches among all keywords, times 100. The green line represents the spline estimate of the long-term trends in the number of searches (the first term in equation (1)). Overlaid in orange is the best-fit model of equation (1) that includes the long-term trends and also the short-term trends due to drop-out of new January dieters (modeled with an exponential decline after January 1st), and also diet drop-outs during the US holiday season in November and December. For all diets, the R 2 of the best-fit model is greater than 95 %
