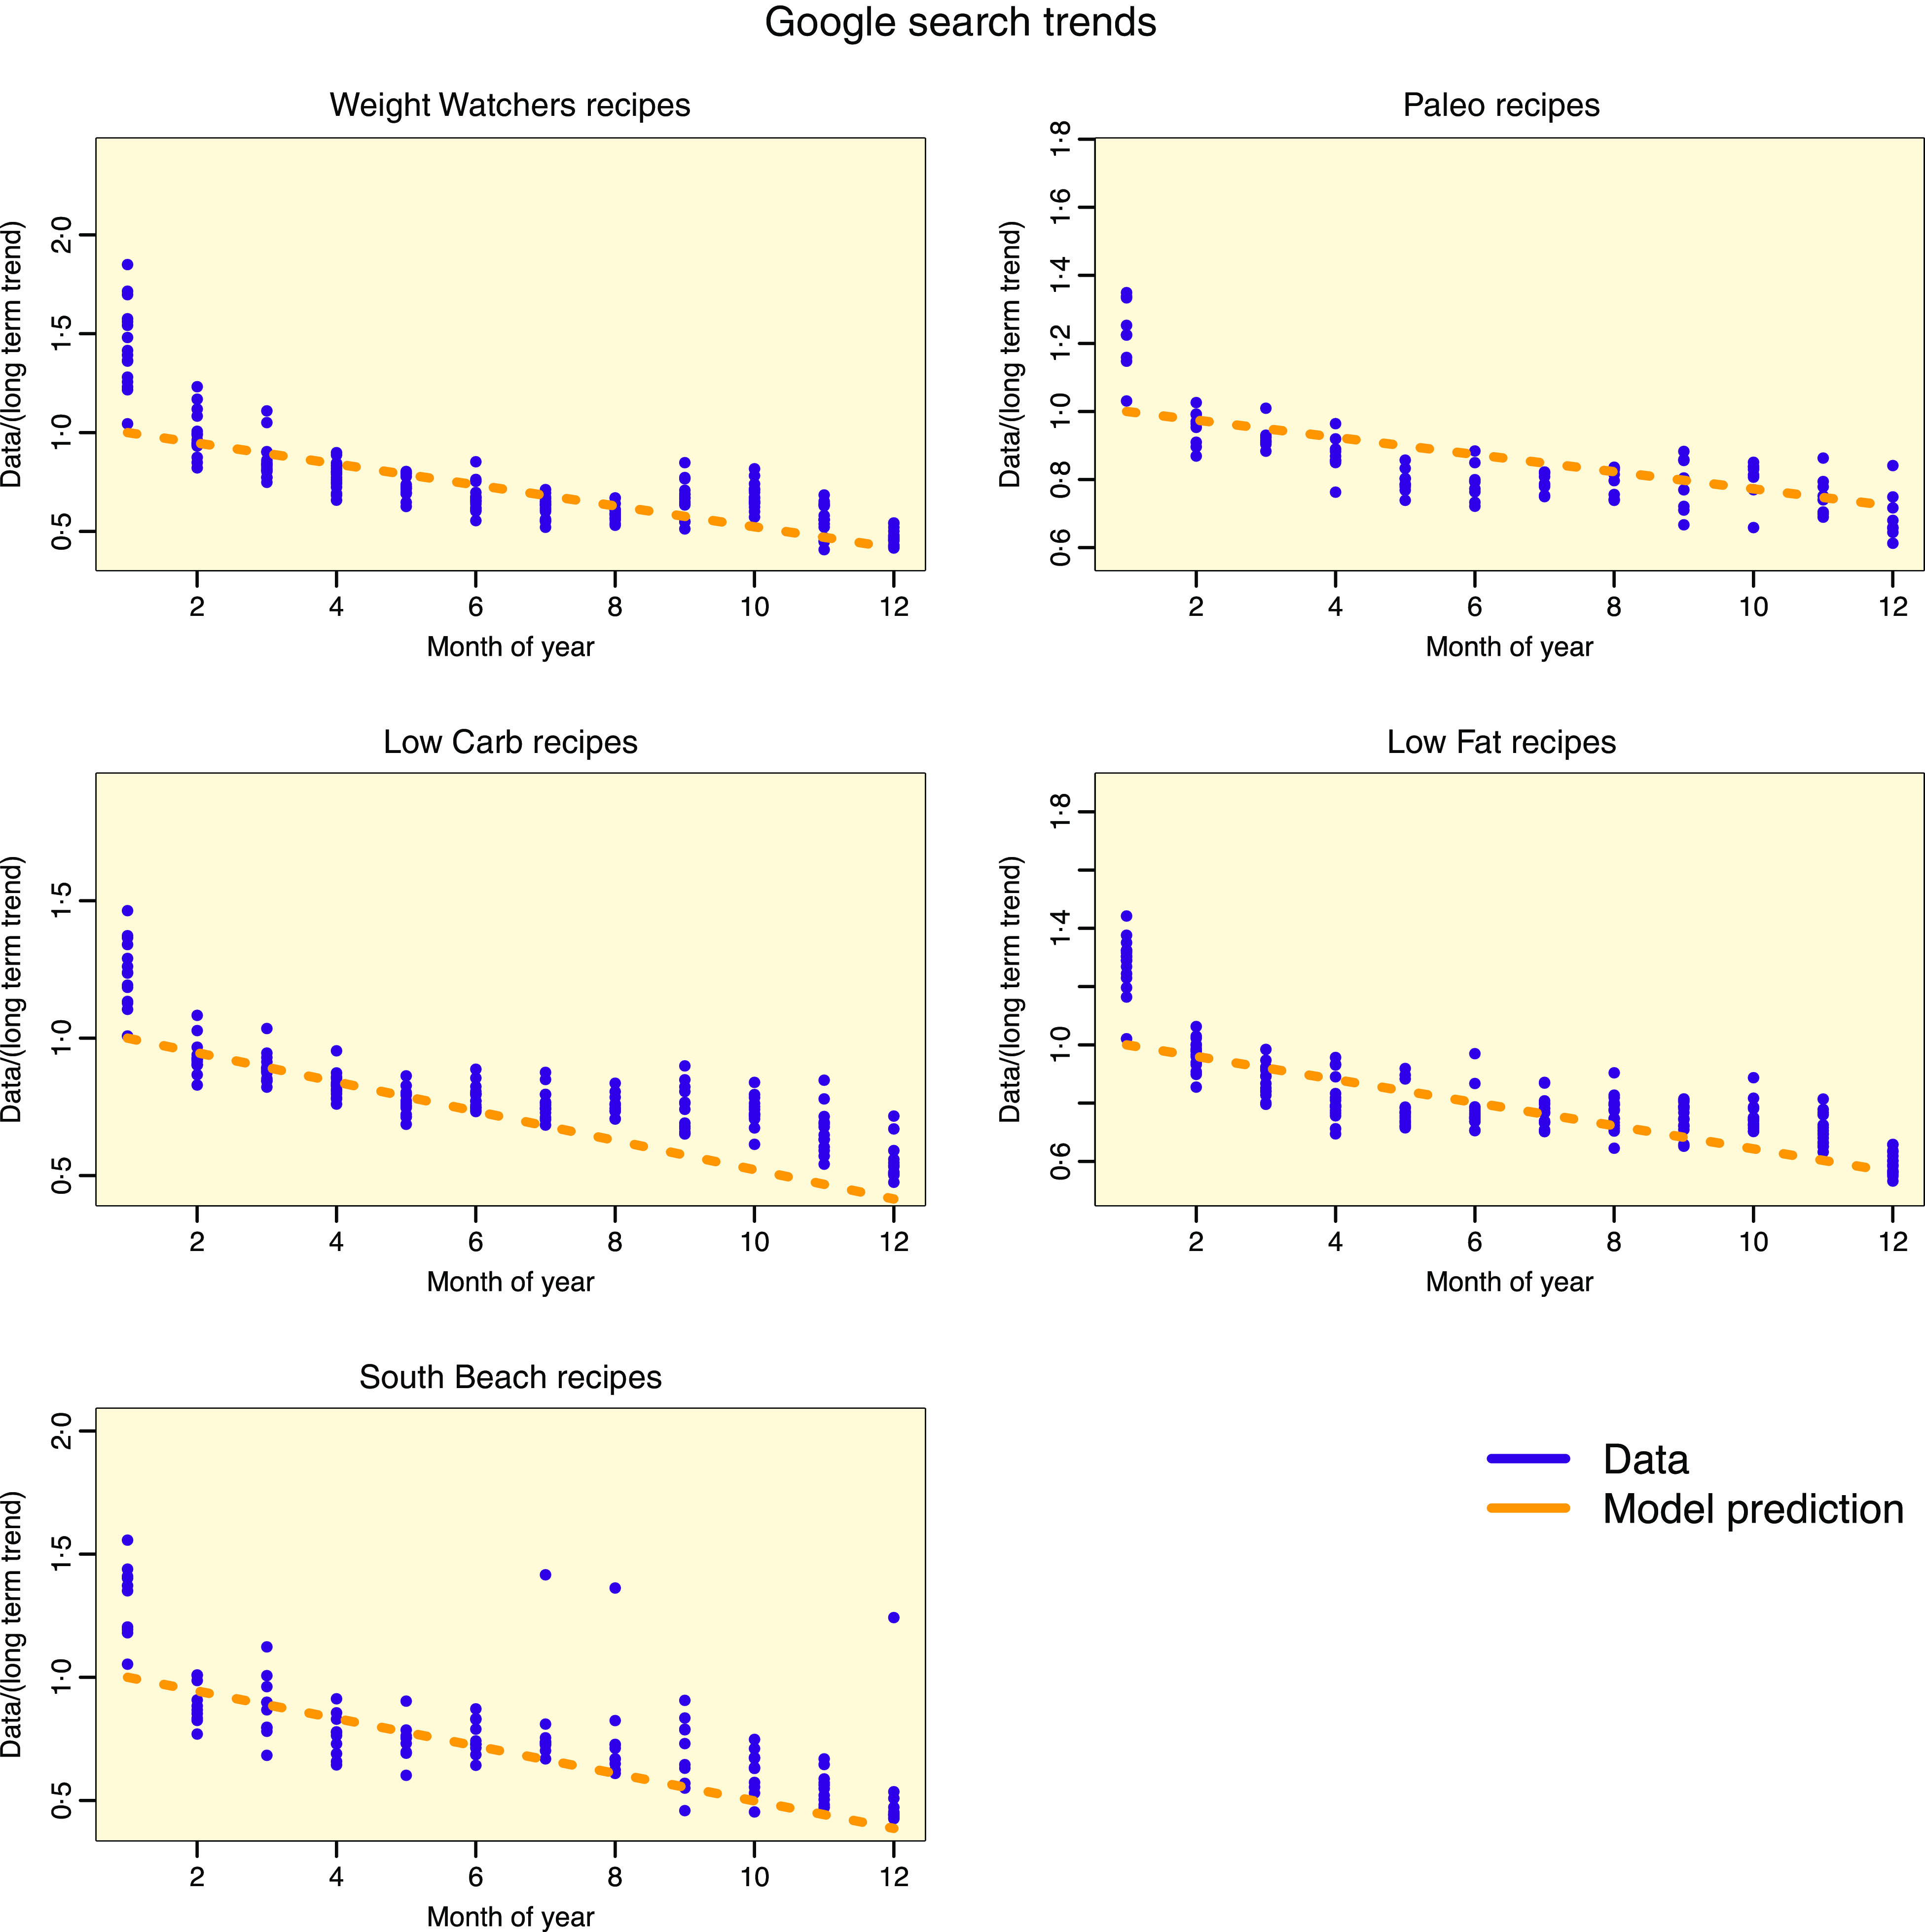
Fig. 6.

Google Trends Internet search data by month for keyword search terms related to recipes for diets, divided by the best-fit long-term trends from the model in equation (2) (which is similar to that used by Marky & Markey(18)). Overlaid in orange is the second term of the best-fit model of equation (2) that includes the short-term trends due to drop-out of new January dieters, modeled with a linear decline after January 1st. For all diets, the linear model consistently under-estimated the number of January dieters, and the exponential decline model of equation (1) provides a better fit to the data (see Fig. 5)
