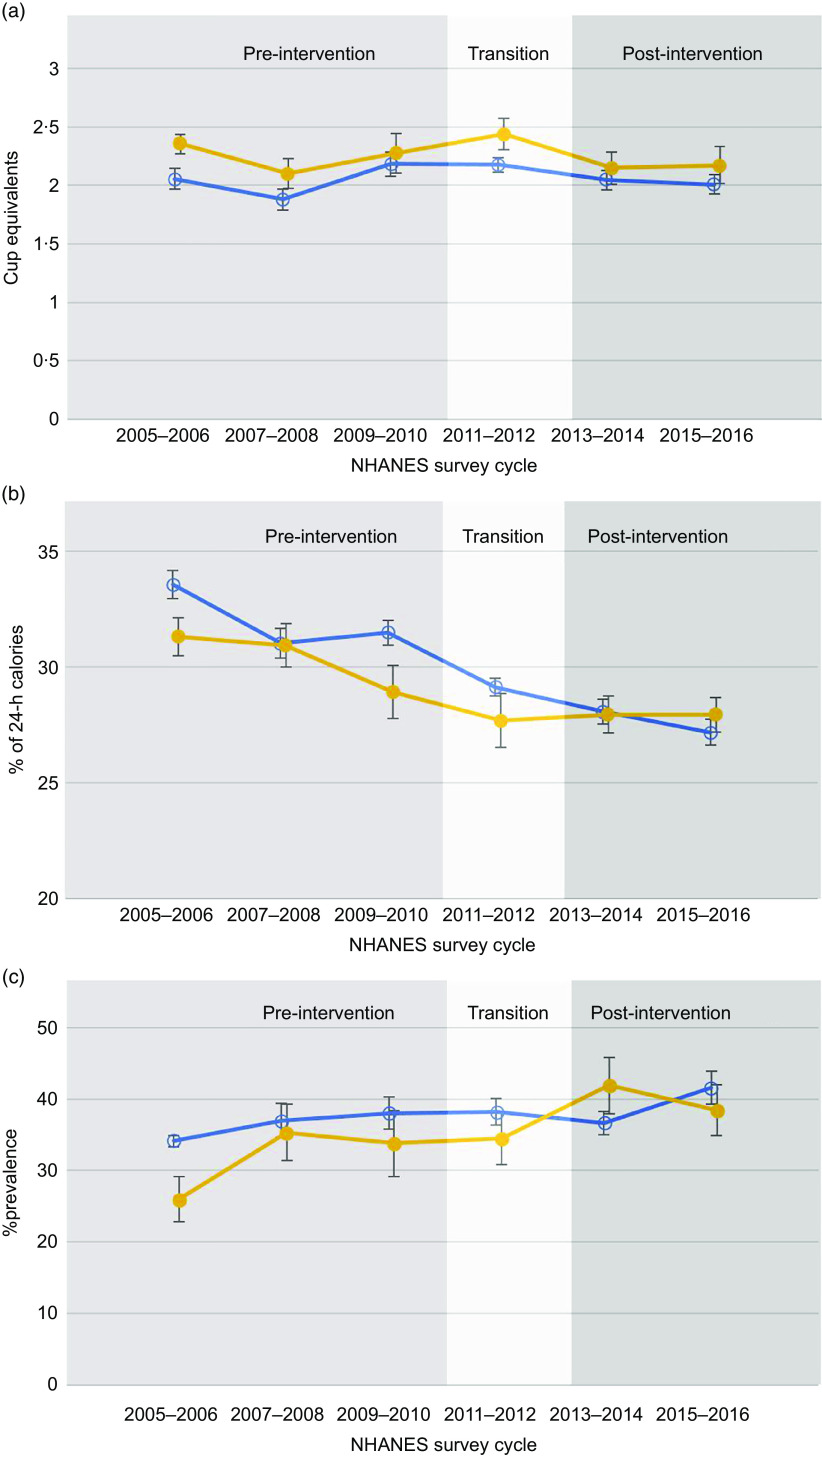
Fig. 1.
(a) Survey-weighted mean weekday fruit and vegetable intake in cup equivalents with se for National School Lunch Program (NSLP) participants (n 7454) and non-participants (n 1718) from 2005 to 2016, using multivariable linear regression adjusted for age, sex, race/ethnicity, daily screen time, country of birth and marital status of the household reference person, household education level and family income. (b) Survey-weighted mean weekday solid fat and added sugar intake as a percentage of 24-h energy intake with se for NSLP participants (n 7454) and non-participants (n 1718) from 2005 to 2016, using multivariable linear regression adjusted for age, sex, race/ethnicity, daily screen time, country of birth and marital status of the household reference person, household education level and family income. (c) Survey-weighted overweight and obesity prevalence with se for NSLP participants (n 7454) and non-participants (n 1718) from 2005 to 2016, using multivariable linear regression adjusted for age, sex, race/ethnicity, daily screen time, country of birth and marital status of the household reference person, household education level and family income. NHANES, National Health and Nutrition Examination Survey.  , NSLP participants;
  , non-participants

