
Fig. 10.
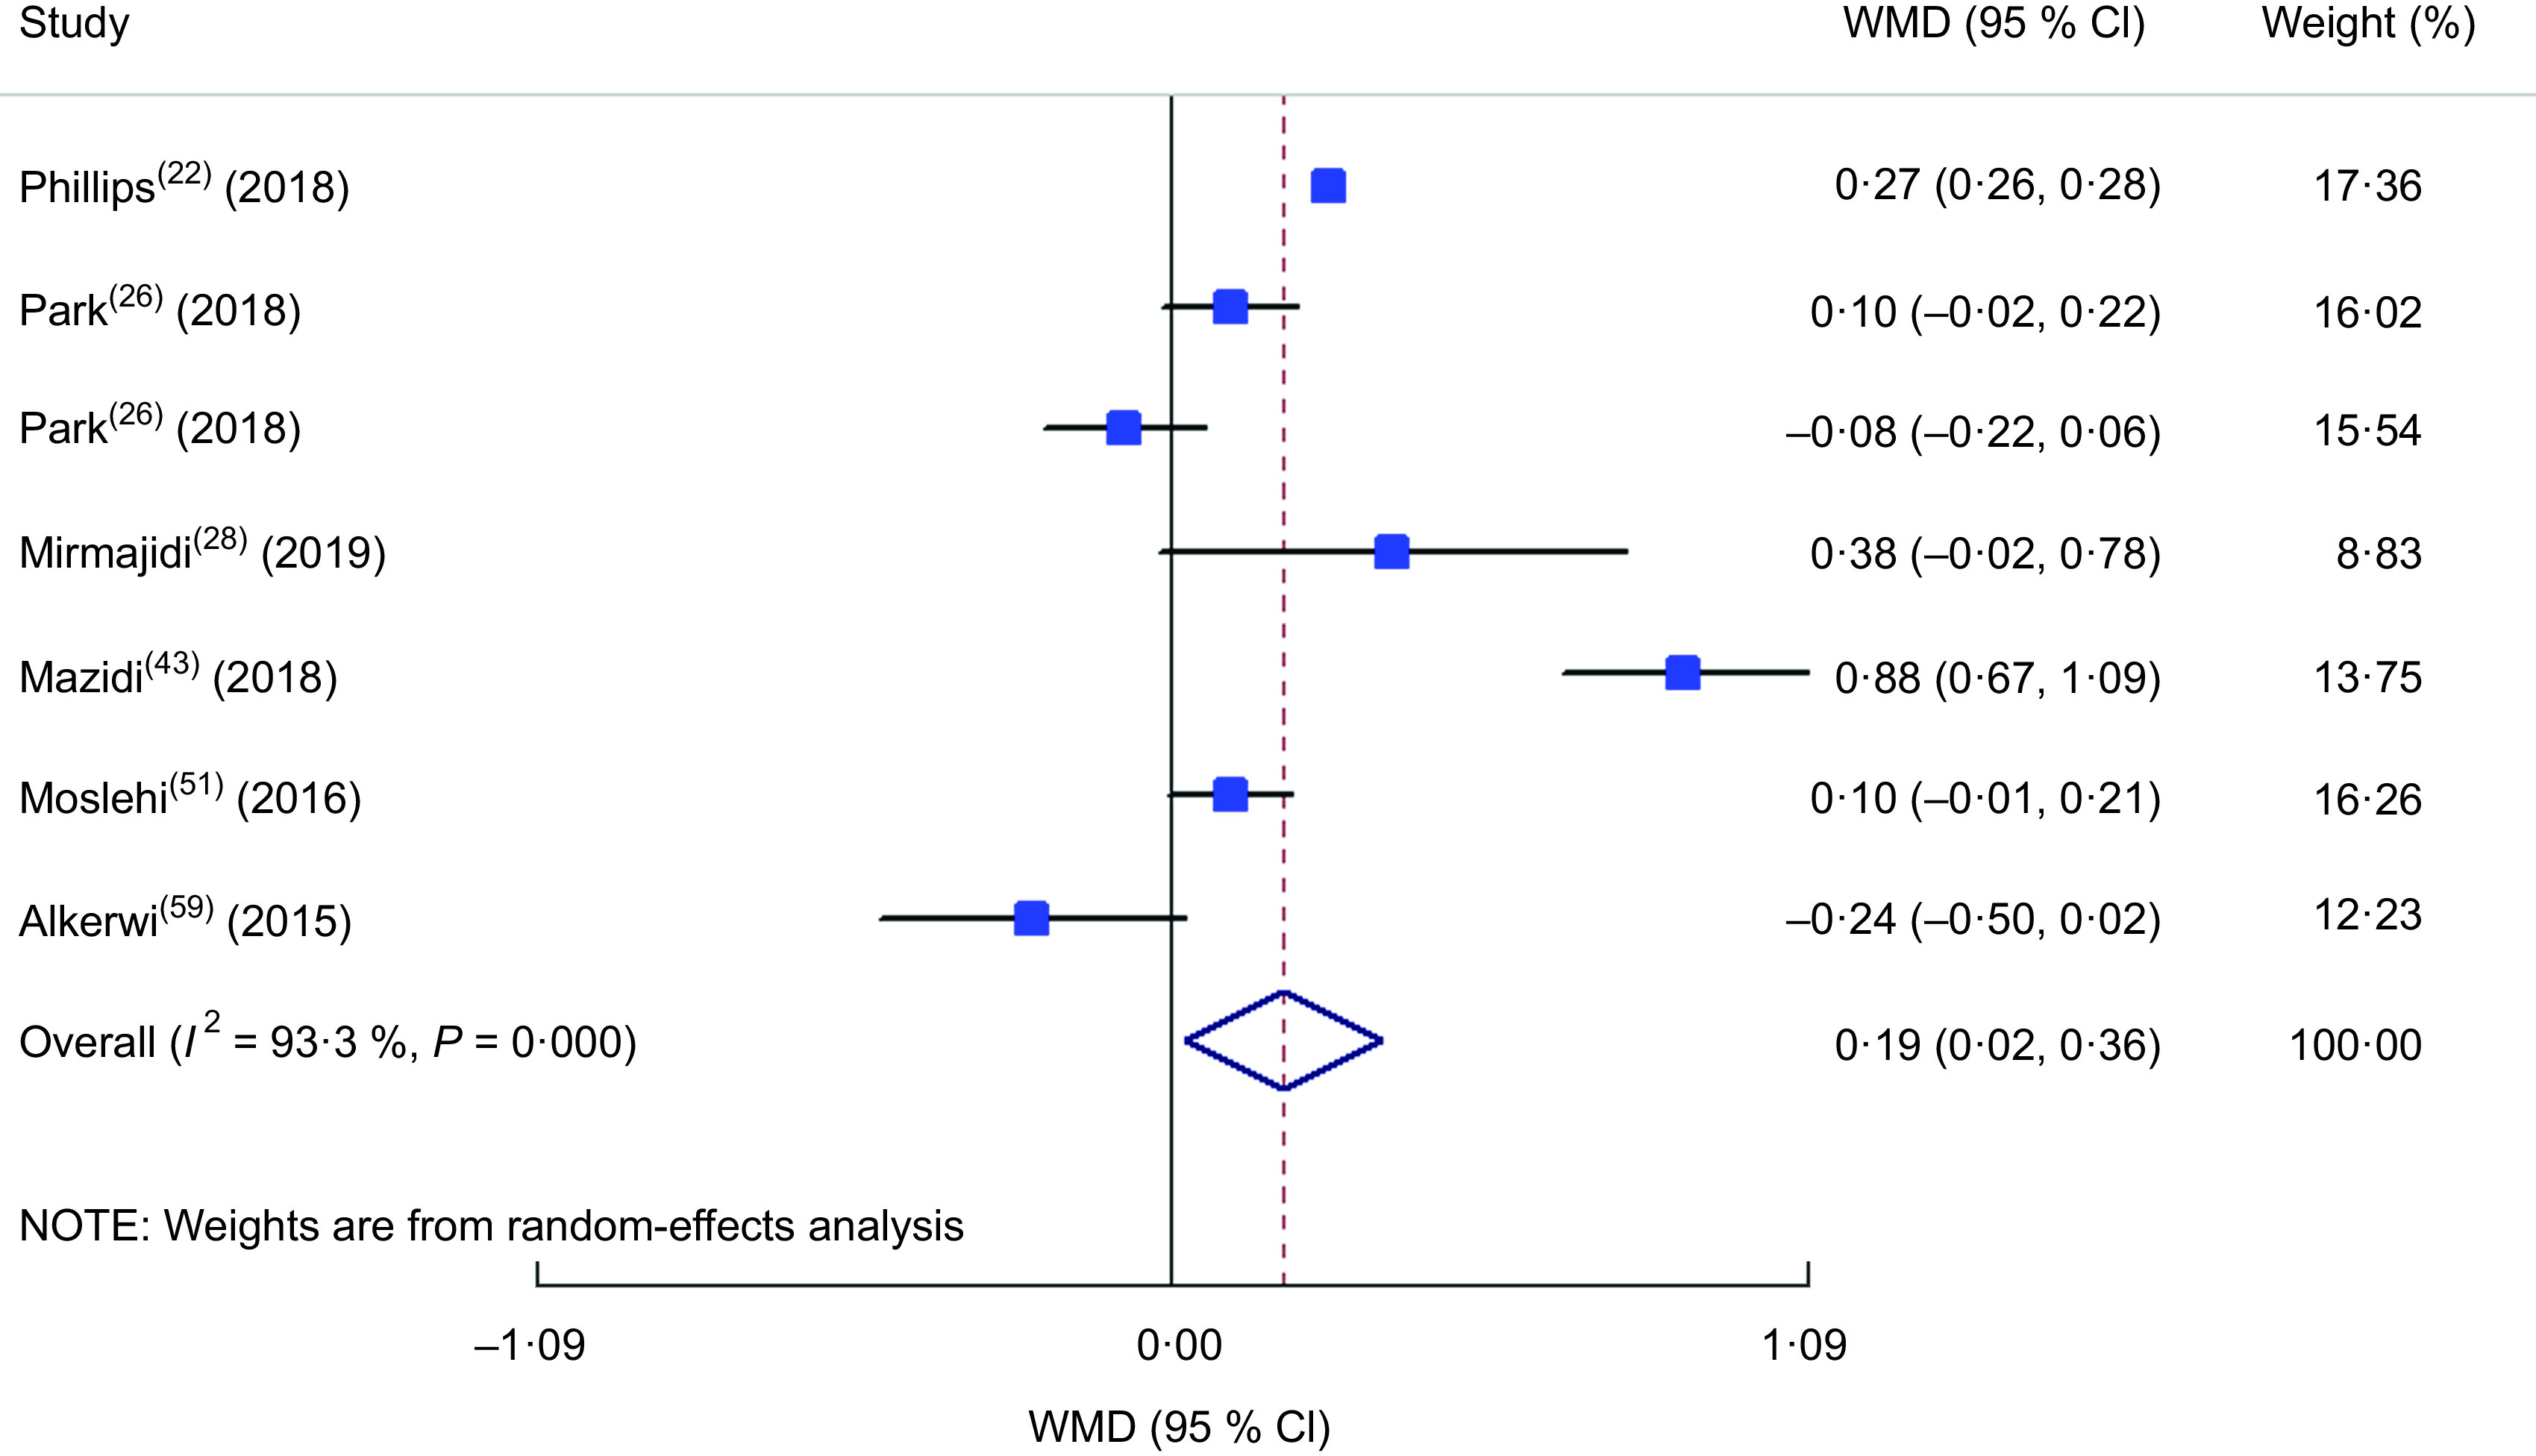
Forest plot illustrating the weighted mean difference (WMD) in homeostatic model assessment of insulin resistance among participants in the highest v. the lowest category of dietary inflammatory index. The study-specific WMD and 95 % CI are represented by the square and horizontal line, respectively; the area of the grey square is proportional to the specific-study weight to the overall meta-analysis. The centre of the open diamond and the vertical dashed line represent the pooled WMD, and the width of the open diamond represents the pooled 95 % CI