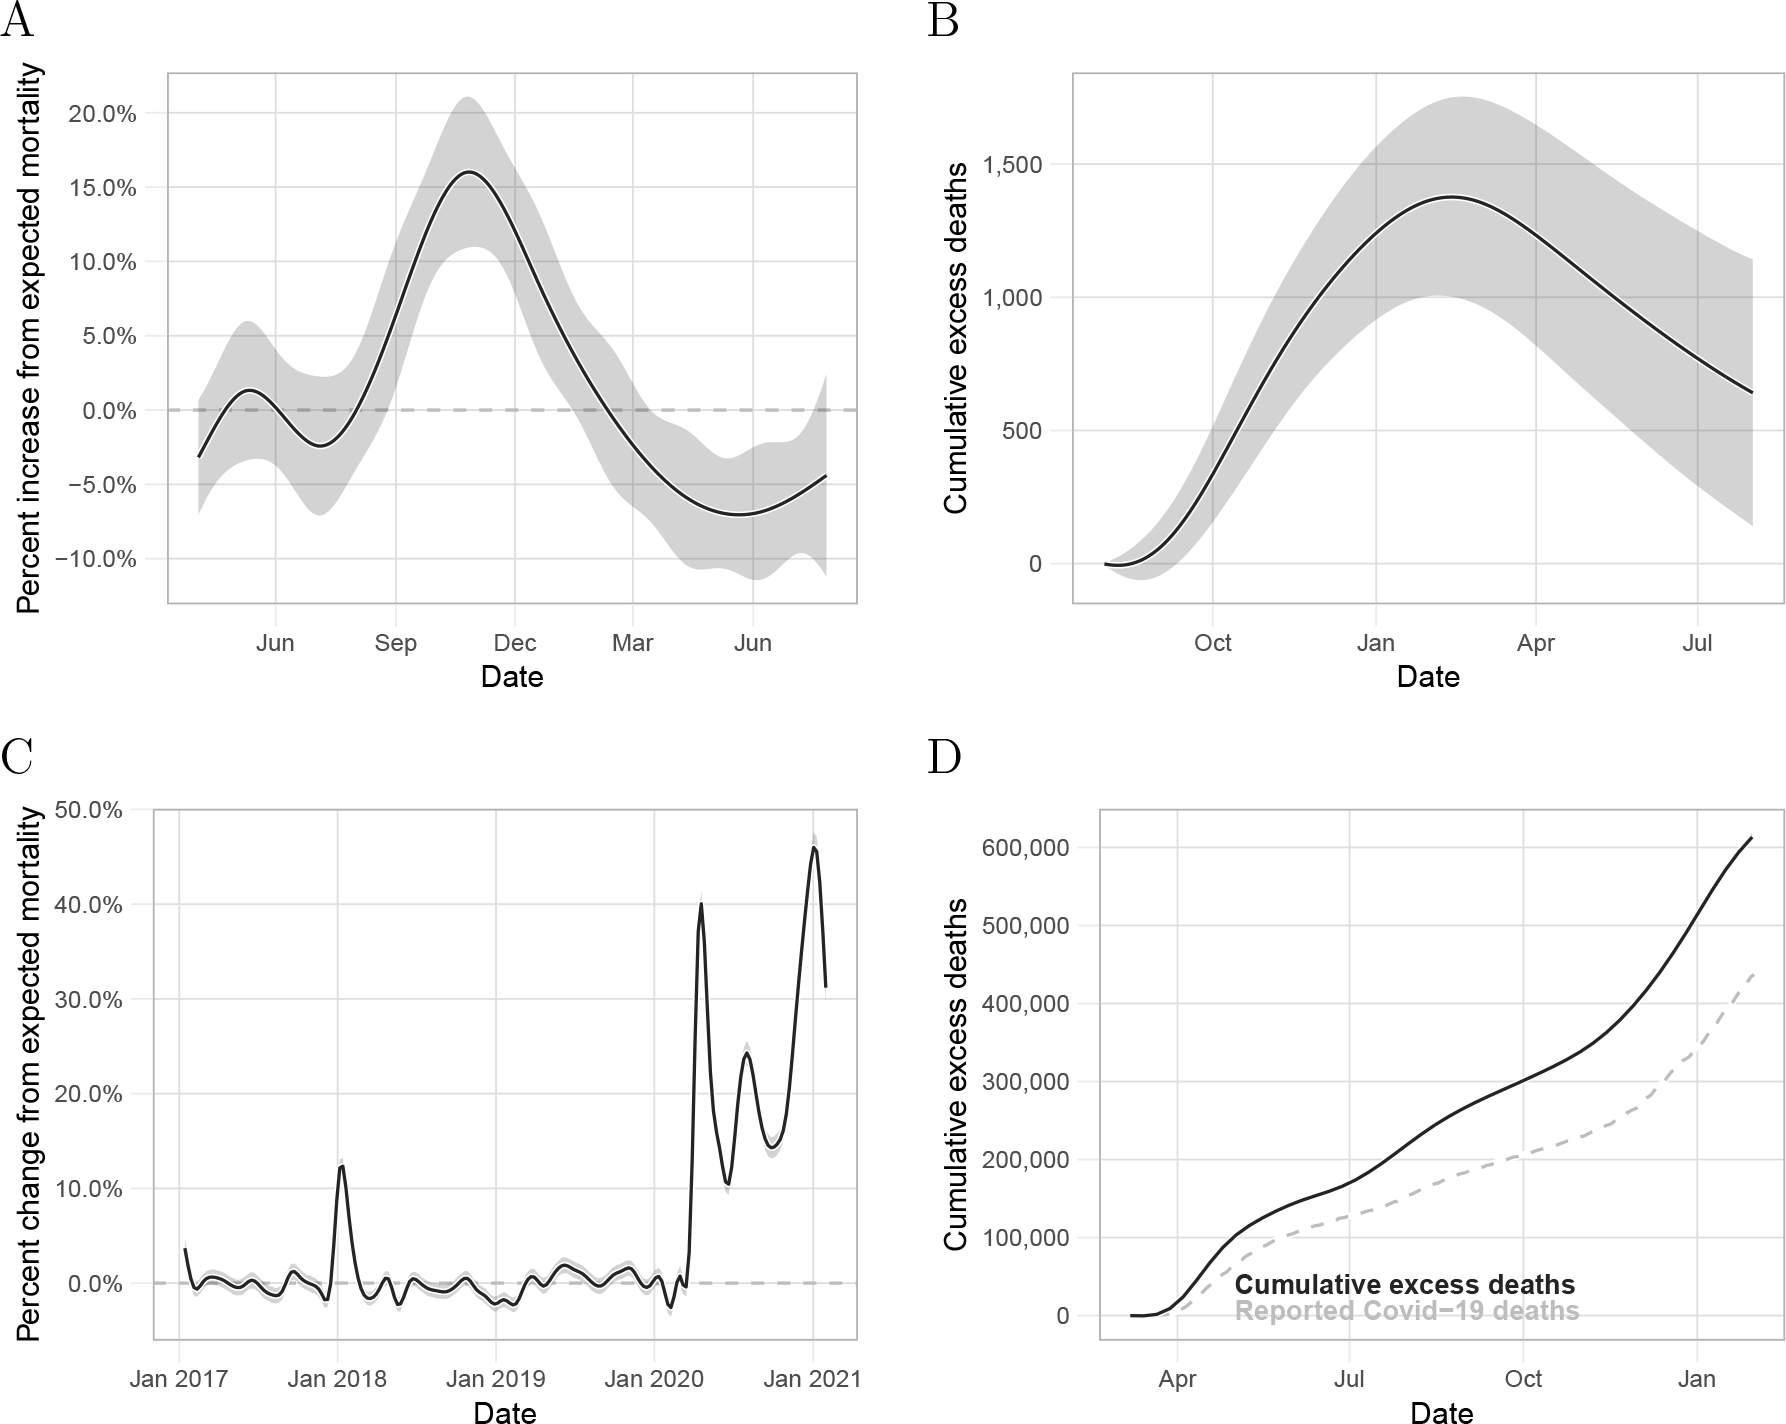
Figure 3:

Detecting epidemics and outbreaks. A) Estimated percent change from expected mortality and point-wise 95% confidence interval for the period associated with the Chikungunya outbreak in Puerto Rico. B) Estimated cumulative excess deaths and point-wise confidence intervals for the period associated with the Chikungunya outbreak. C) Estimated percent change from expected mortality and point-wise 95% confidence interval for the United States from January 2017 to January 2021. D) Estimated cumulative excess deaths and point-wise confidence intervals for the United States during the period associated with the COVID-19 pandemic. The dashed-gray curve is the cumulative COVID-19 related deaths reported by The New York Times.
