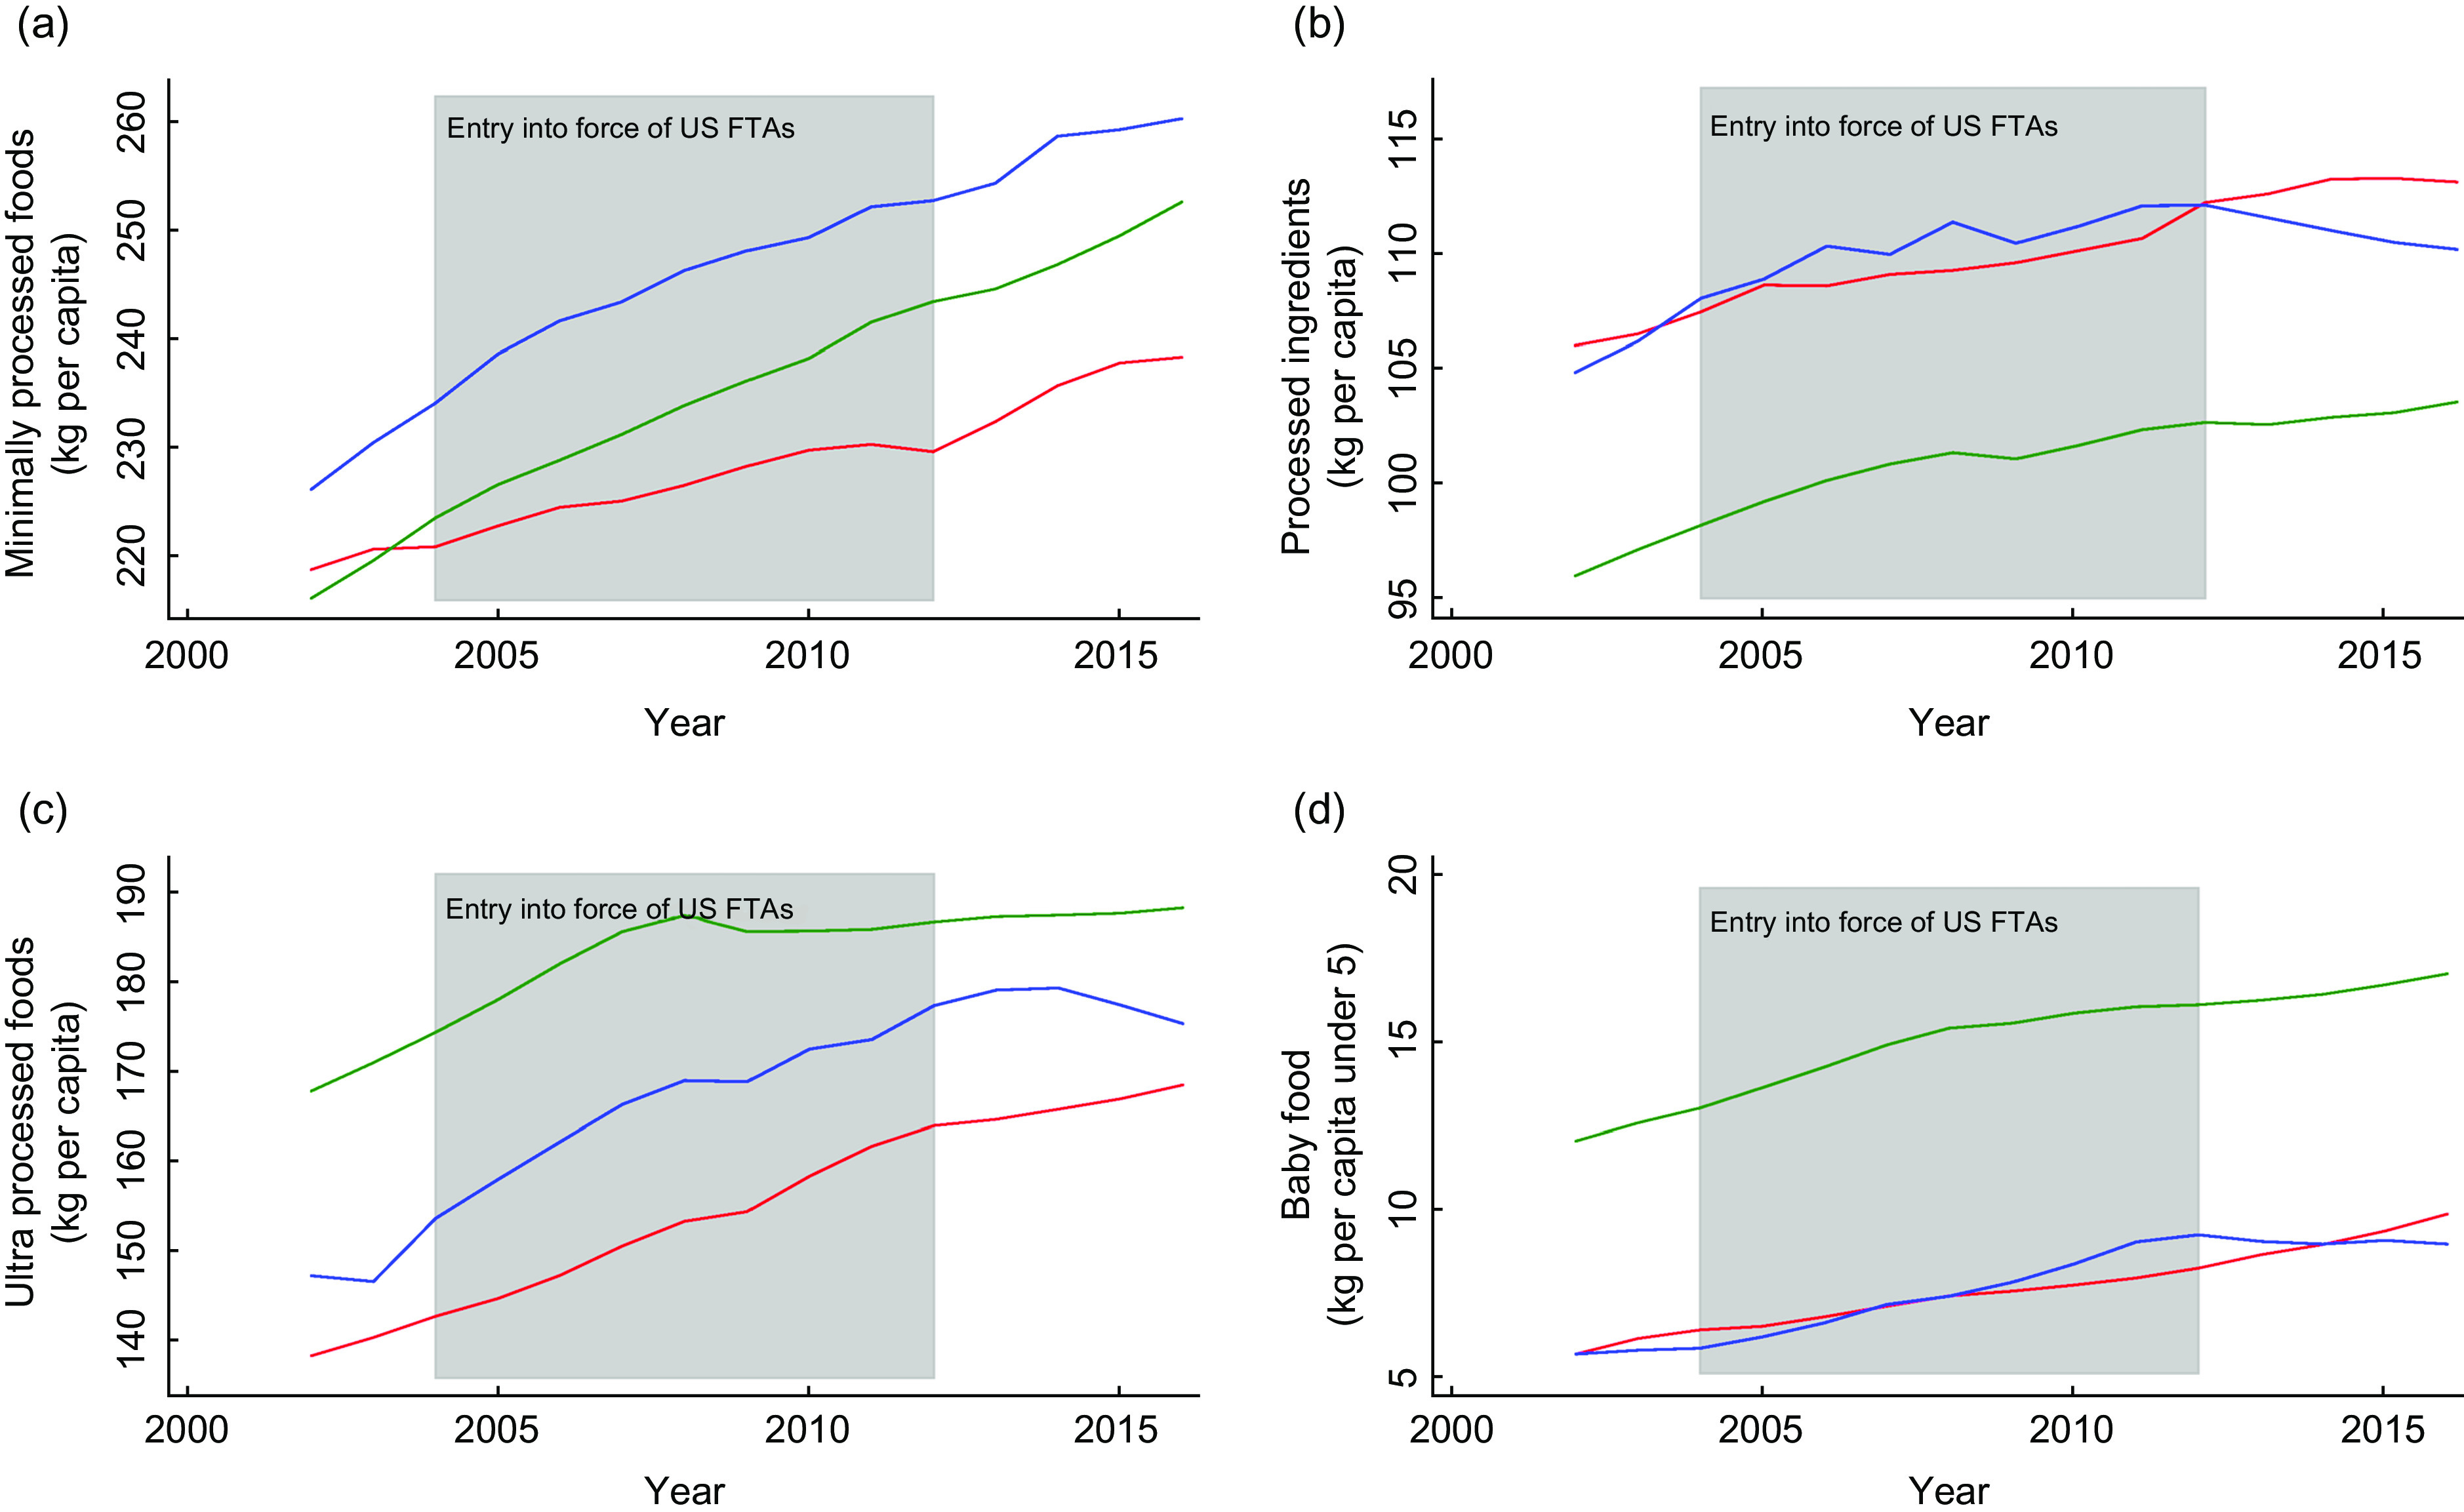
Fig. 1.

Annual mean per capita sales volumes (unadjusted for covariates) in exposed countries, all unexposed countries and matched unexposed countries (weighted), 2002–2016: (a) minimally processed foods, (b) processed culinary ingredients, (c) ultra-processed products and (d) baby foods.  , exposed mean;
  , matched unexposed mean;
  , all unexposed mean. FTA, free trade agreements
Range of years of entry into force of US FTAs indicated. Units of the y-axes are kilograms per capita (population under age five for baby food and total population for all other outcomes). (Data from Hong Kong excluded for baby food).
