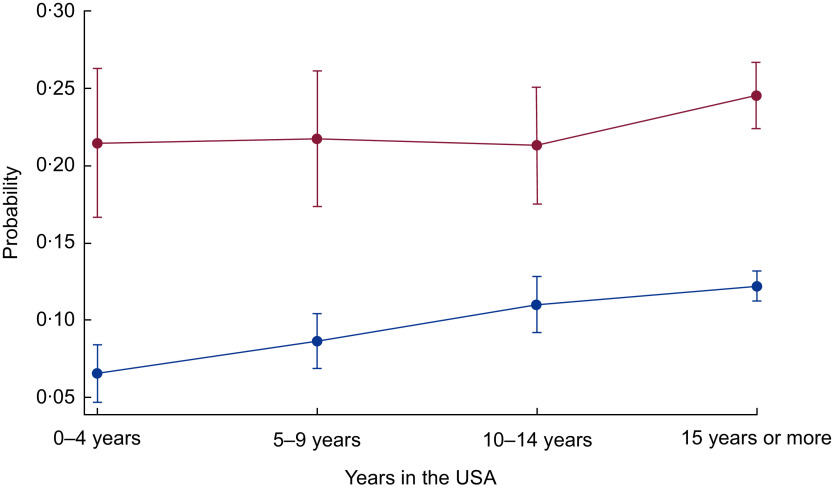
Fig. 4.
Probability of self-rated poor health over years of living in the USA by food security status ( , food secure;
  , food insecure) among low-income, working-age immigrant adults. Data source is the pooled National Health Interview Survey 2011–2015. Values are probabilities, with their se represented by vertical bars. Estimates account for complex survey design and confidence intervals are estimated at the 95 % level

