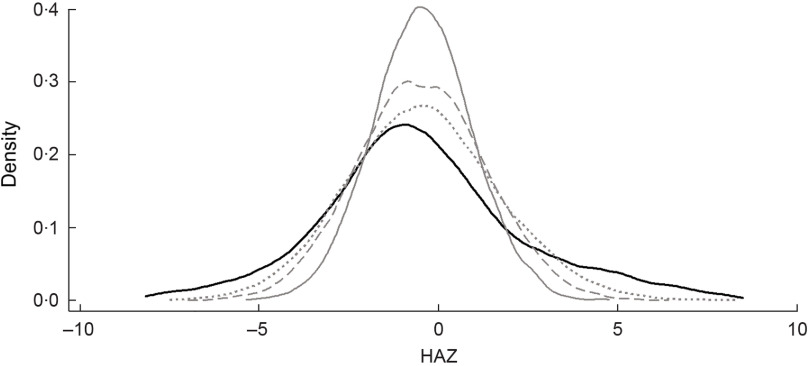
Fig. 2.
Height-for-age Z-score (HAZ) distributions based on different scenarios ( , observed distribution of Z-scores;
  , simulated under conservative scenario;
  , simulated under moderate scenario;
  , simulated under aggressive scenario) for children aged 24–59 months from three rounds of the Demographic and Health Survey (DHS) in Egypt (2005, 2008 and 2014)

