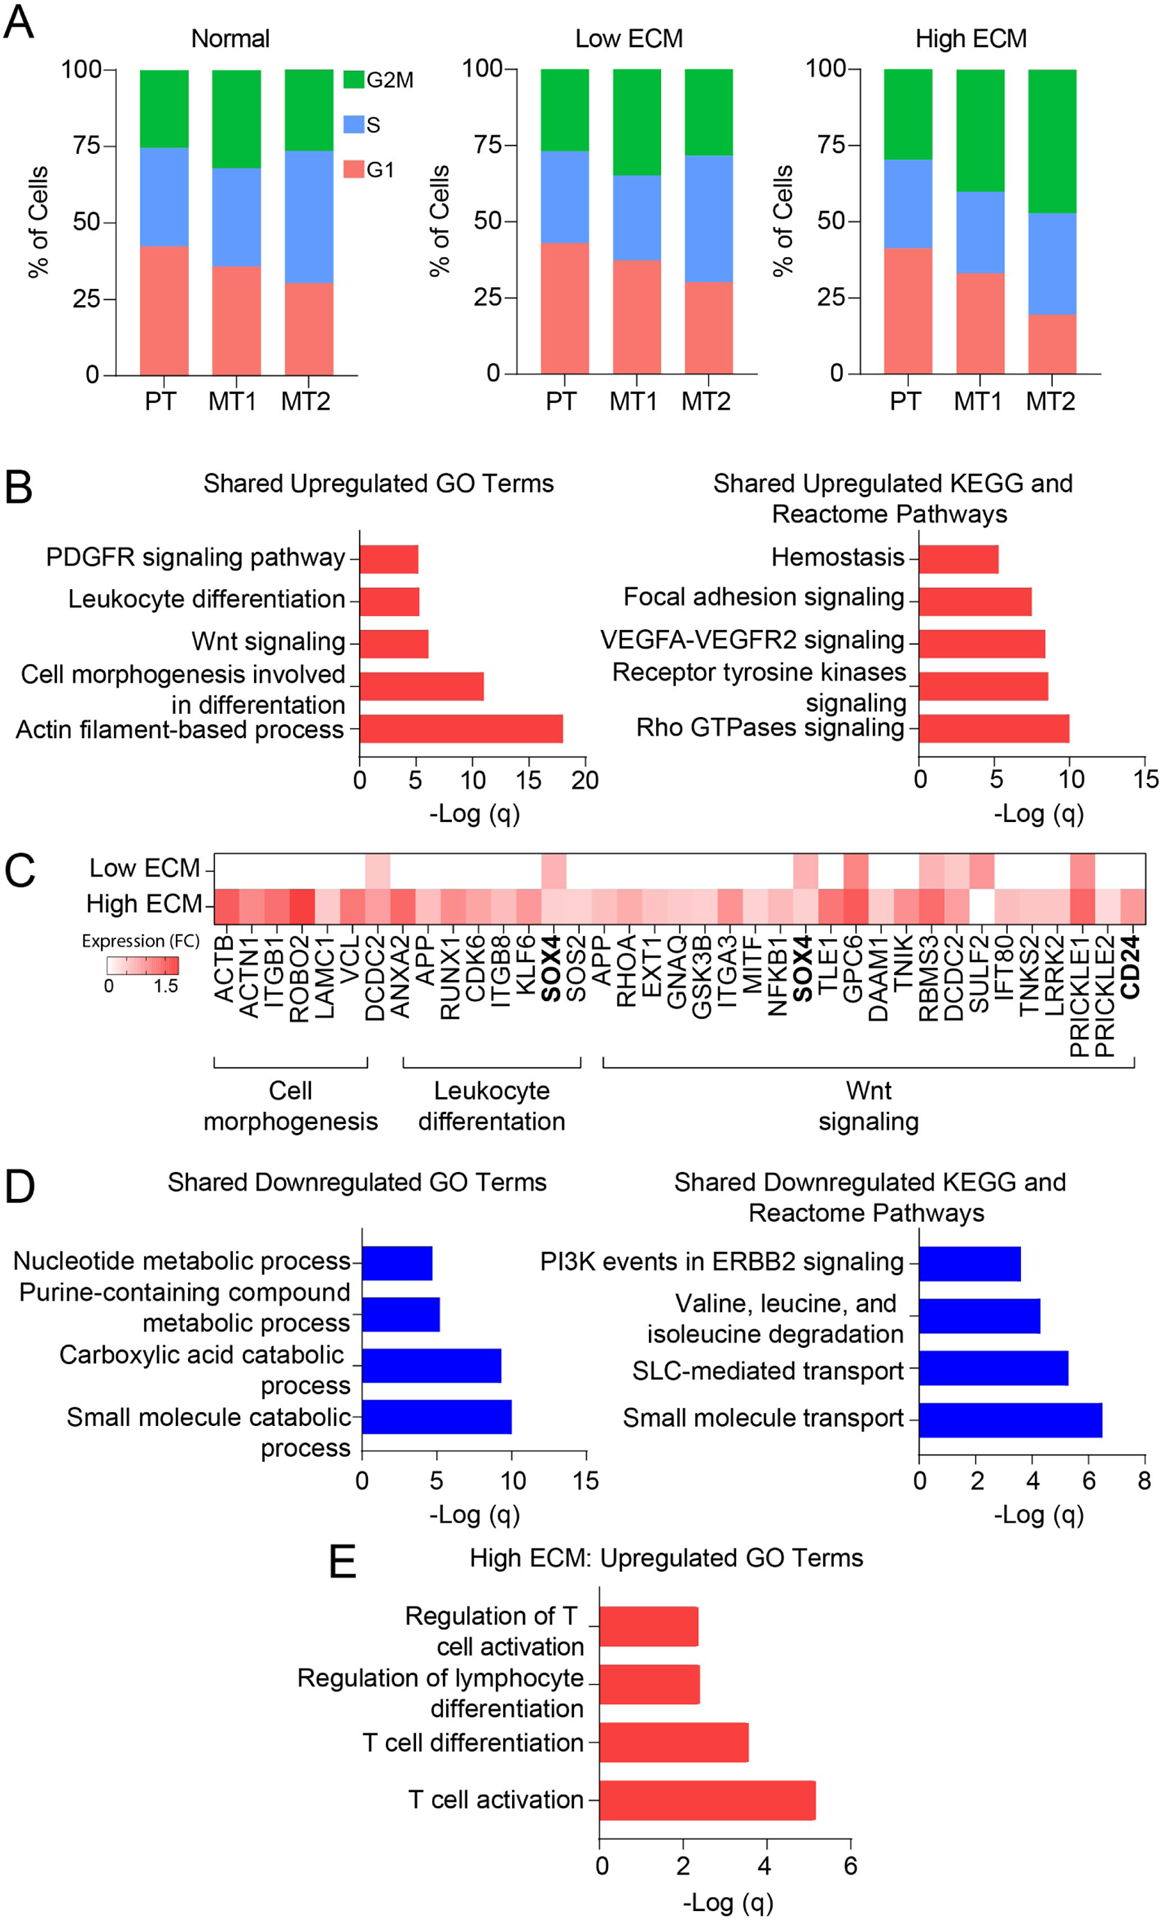
Fig. 2. Cell cycle and gene expression analysis of the mixed tubular 1 cell cluster.

(A) Proportion of epithelial tubular cells at different cell cycle stages using average transcriptional expression data. Orange, G1 phase; green, S phase; and blue, G2M phase. MT1, mixed tubular 1; MT2, mixed tubular 2; and PT, proximal tubular cells. (B) Gene enrichment analysis showing the top upregulated GO terms and pathways shared in fibrotic grafts. (C) Heatmap of upregulated gene expression using selected genes panel B. Expression is represented as log2 FC values. (D) Gene ontology pathway analysis showing the top downregulated GO terms and pathways shared in fibrotic grafts. (E) Gene ontology pathway analysis showing the top upregulated pathways unique to high ECM.
